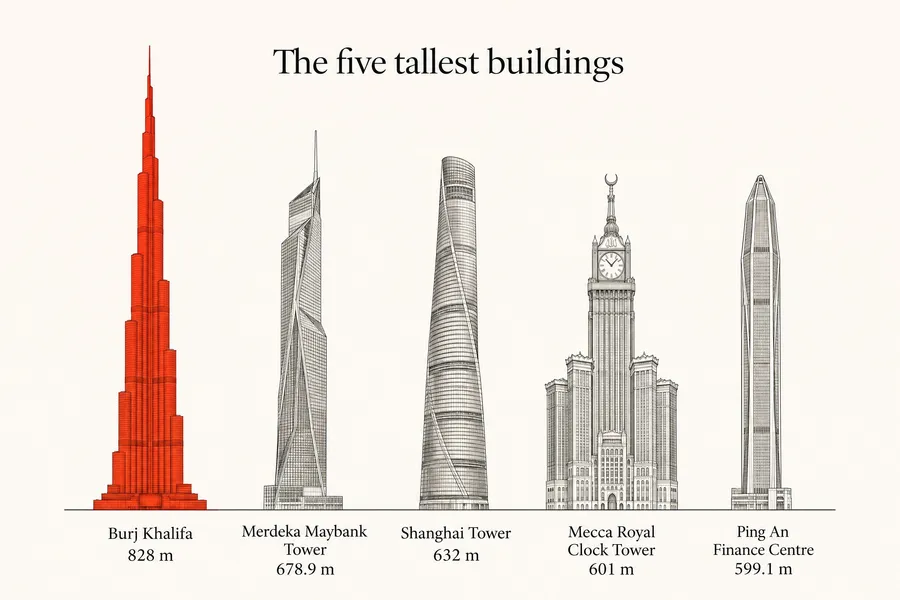
AI Infographic Generator for Charts, Timelines and Explainers
Paste your numbers and describe the look, from a Swiss bar chart to a botanical life cycle. You get a designed infographic with your figures and labels set in clean type, ready to check and share.
Models that set numbers and labels cleanly.
Auto picks a model that handles text and figures well. Switch the model manually any time if you want to compare.


One dataset, four infographic styles
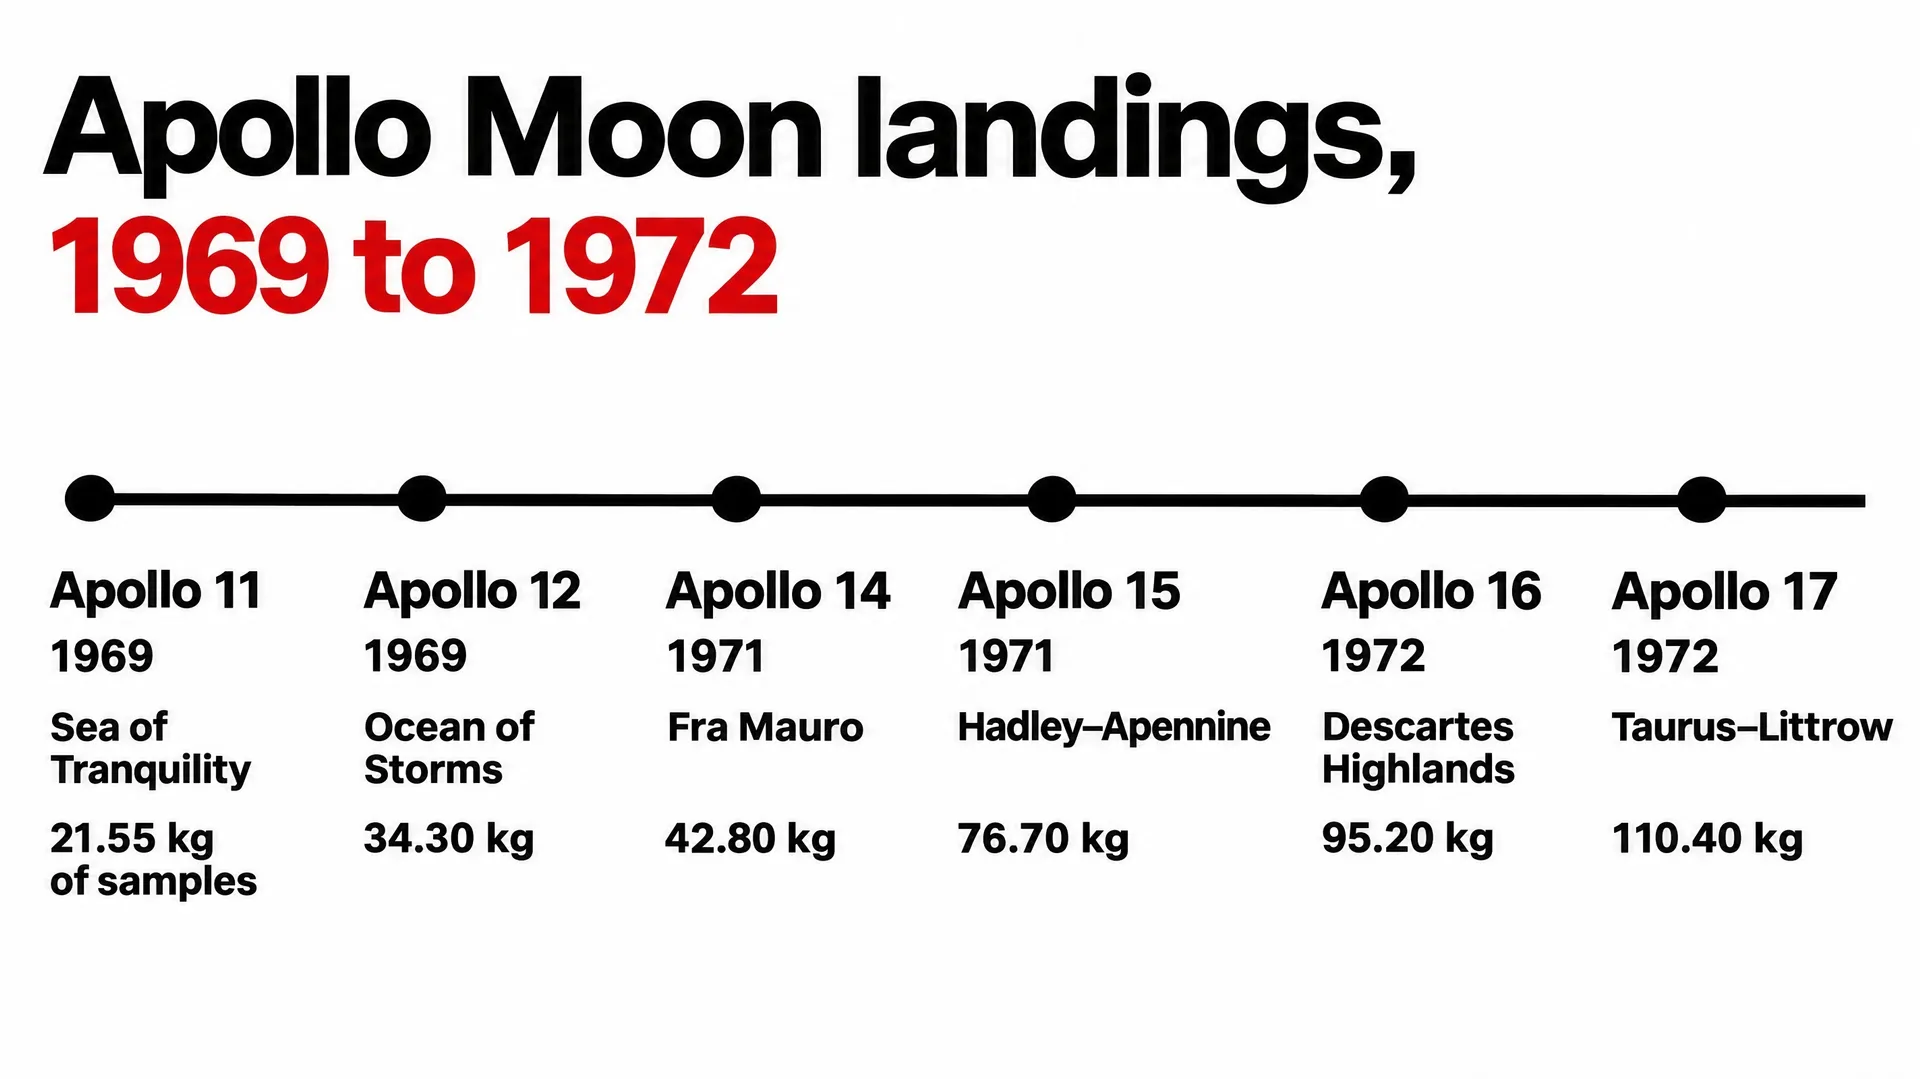
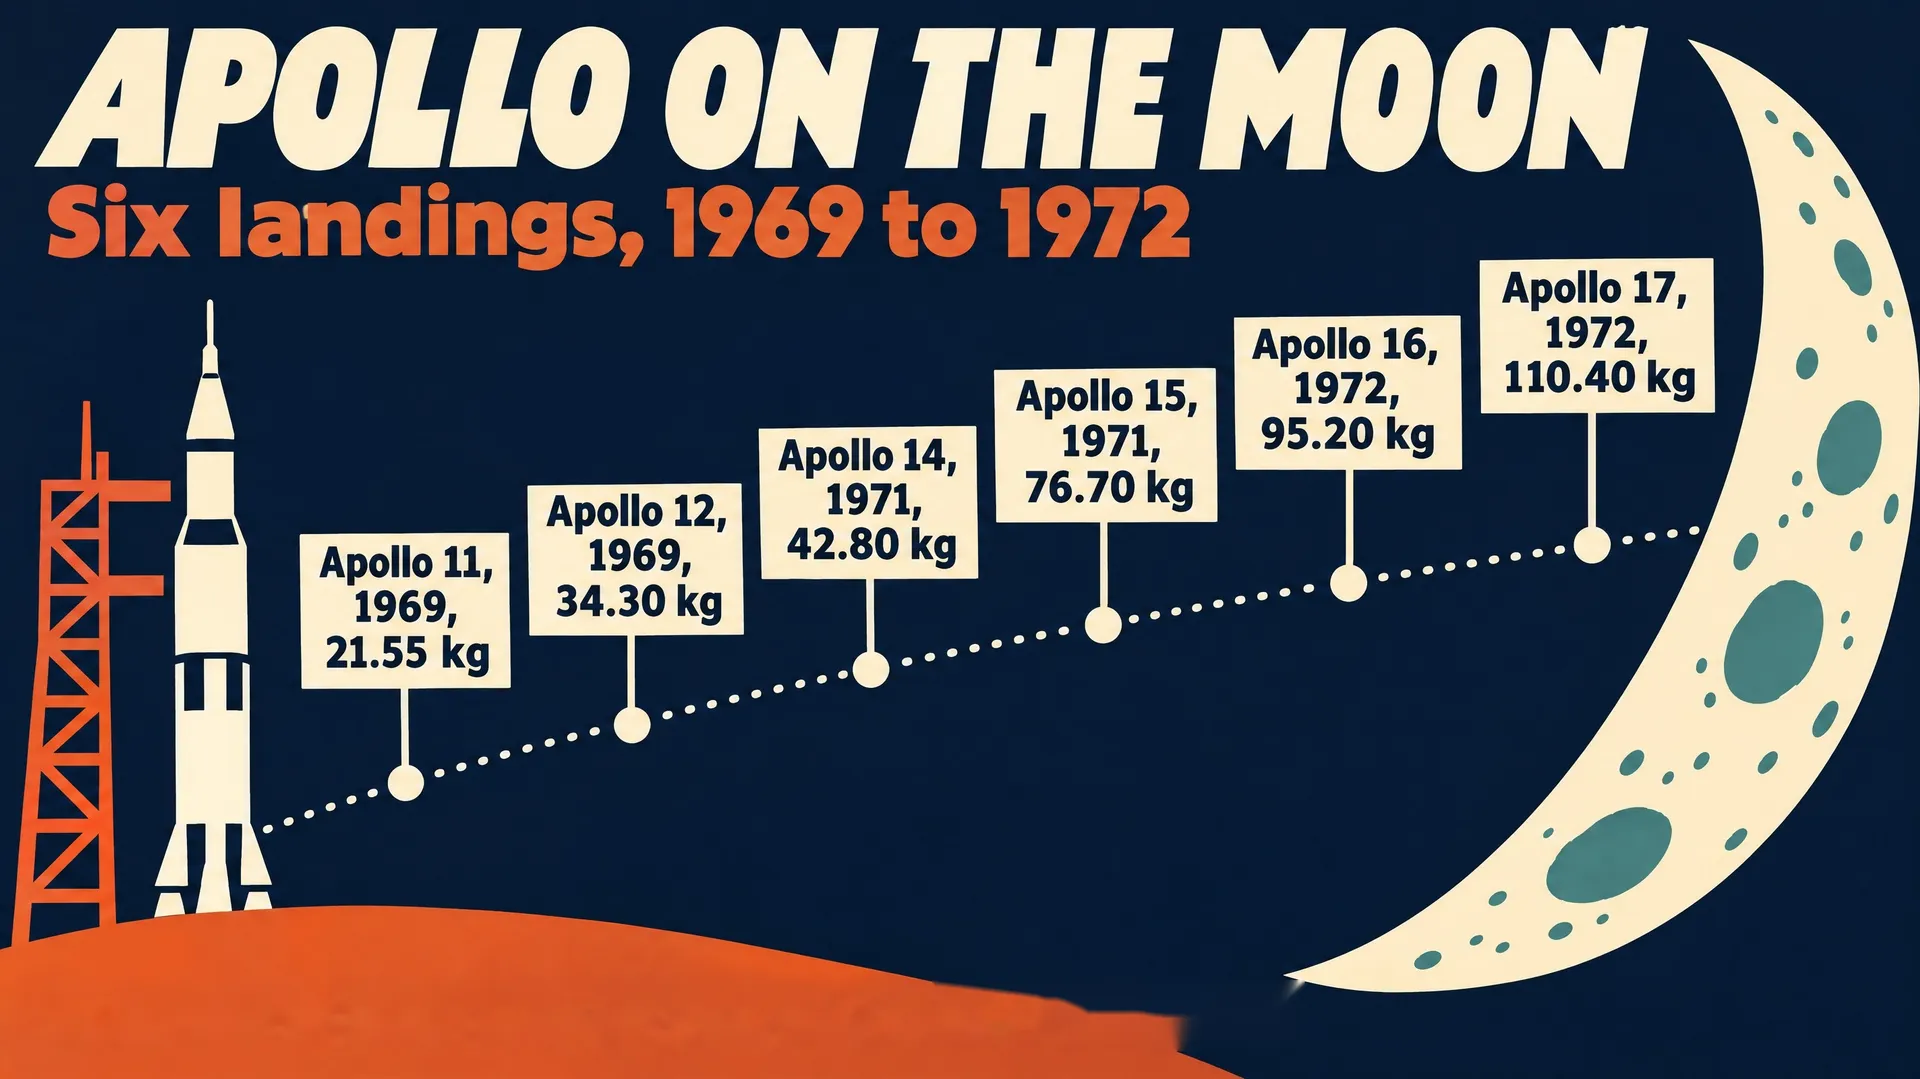
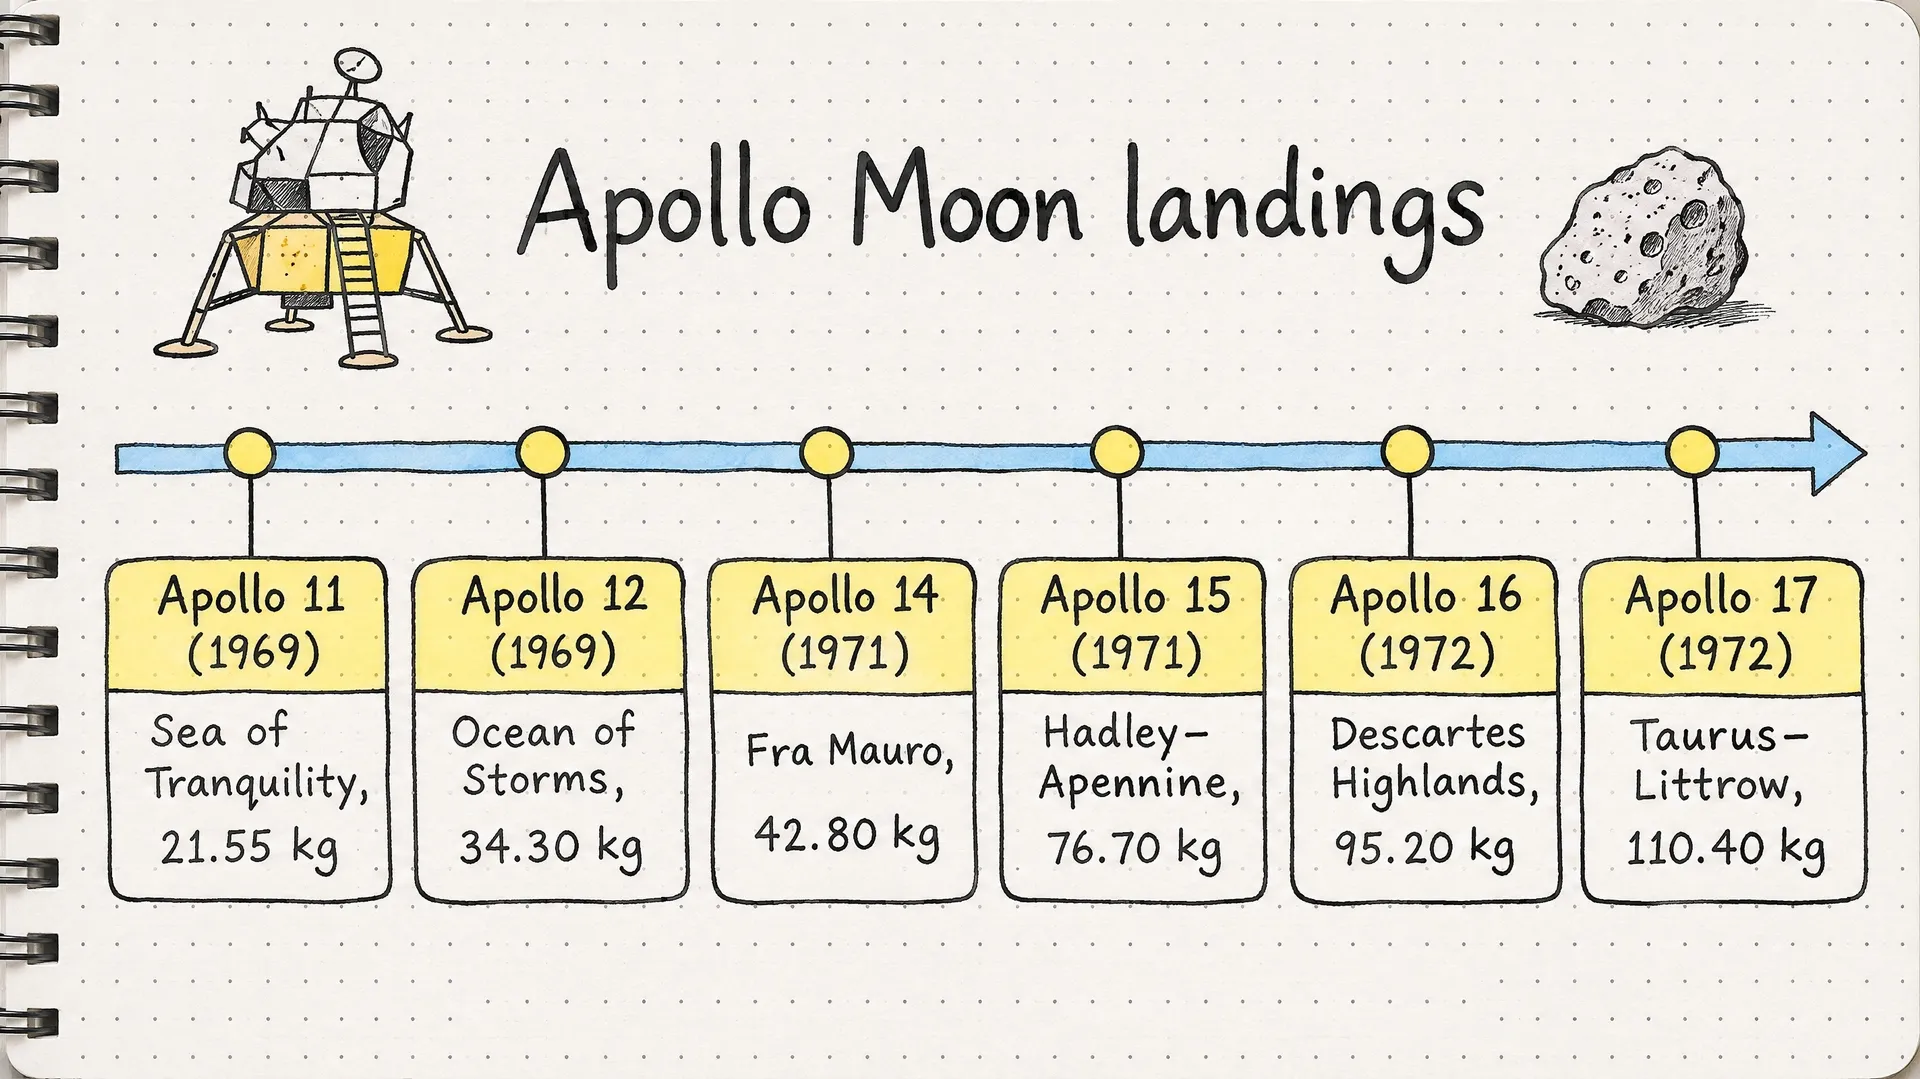
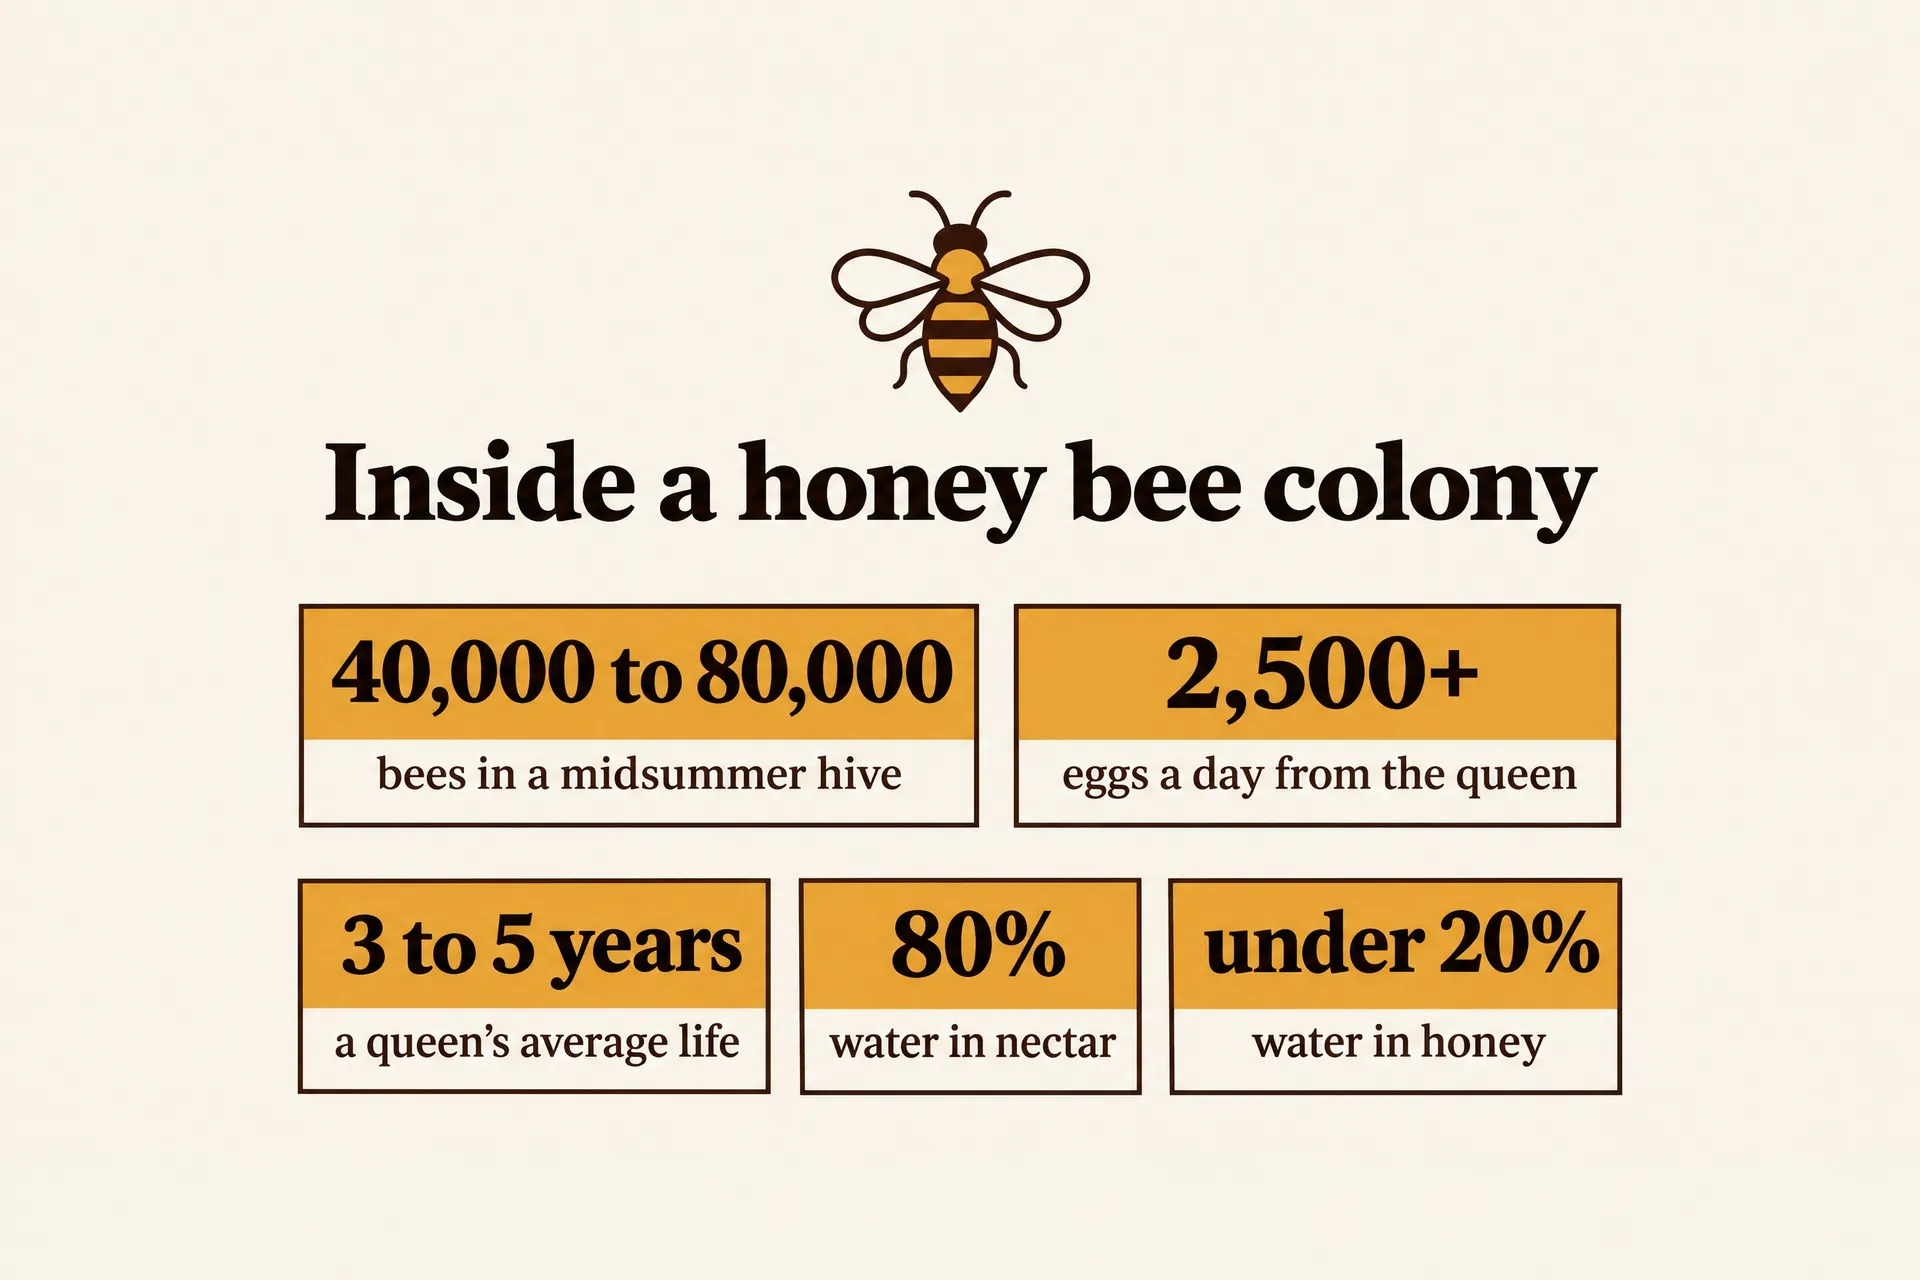
The same numbers can look like a report page, a museum poster or a page from a notebook. Pick the style for the place where people will see the infographic.
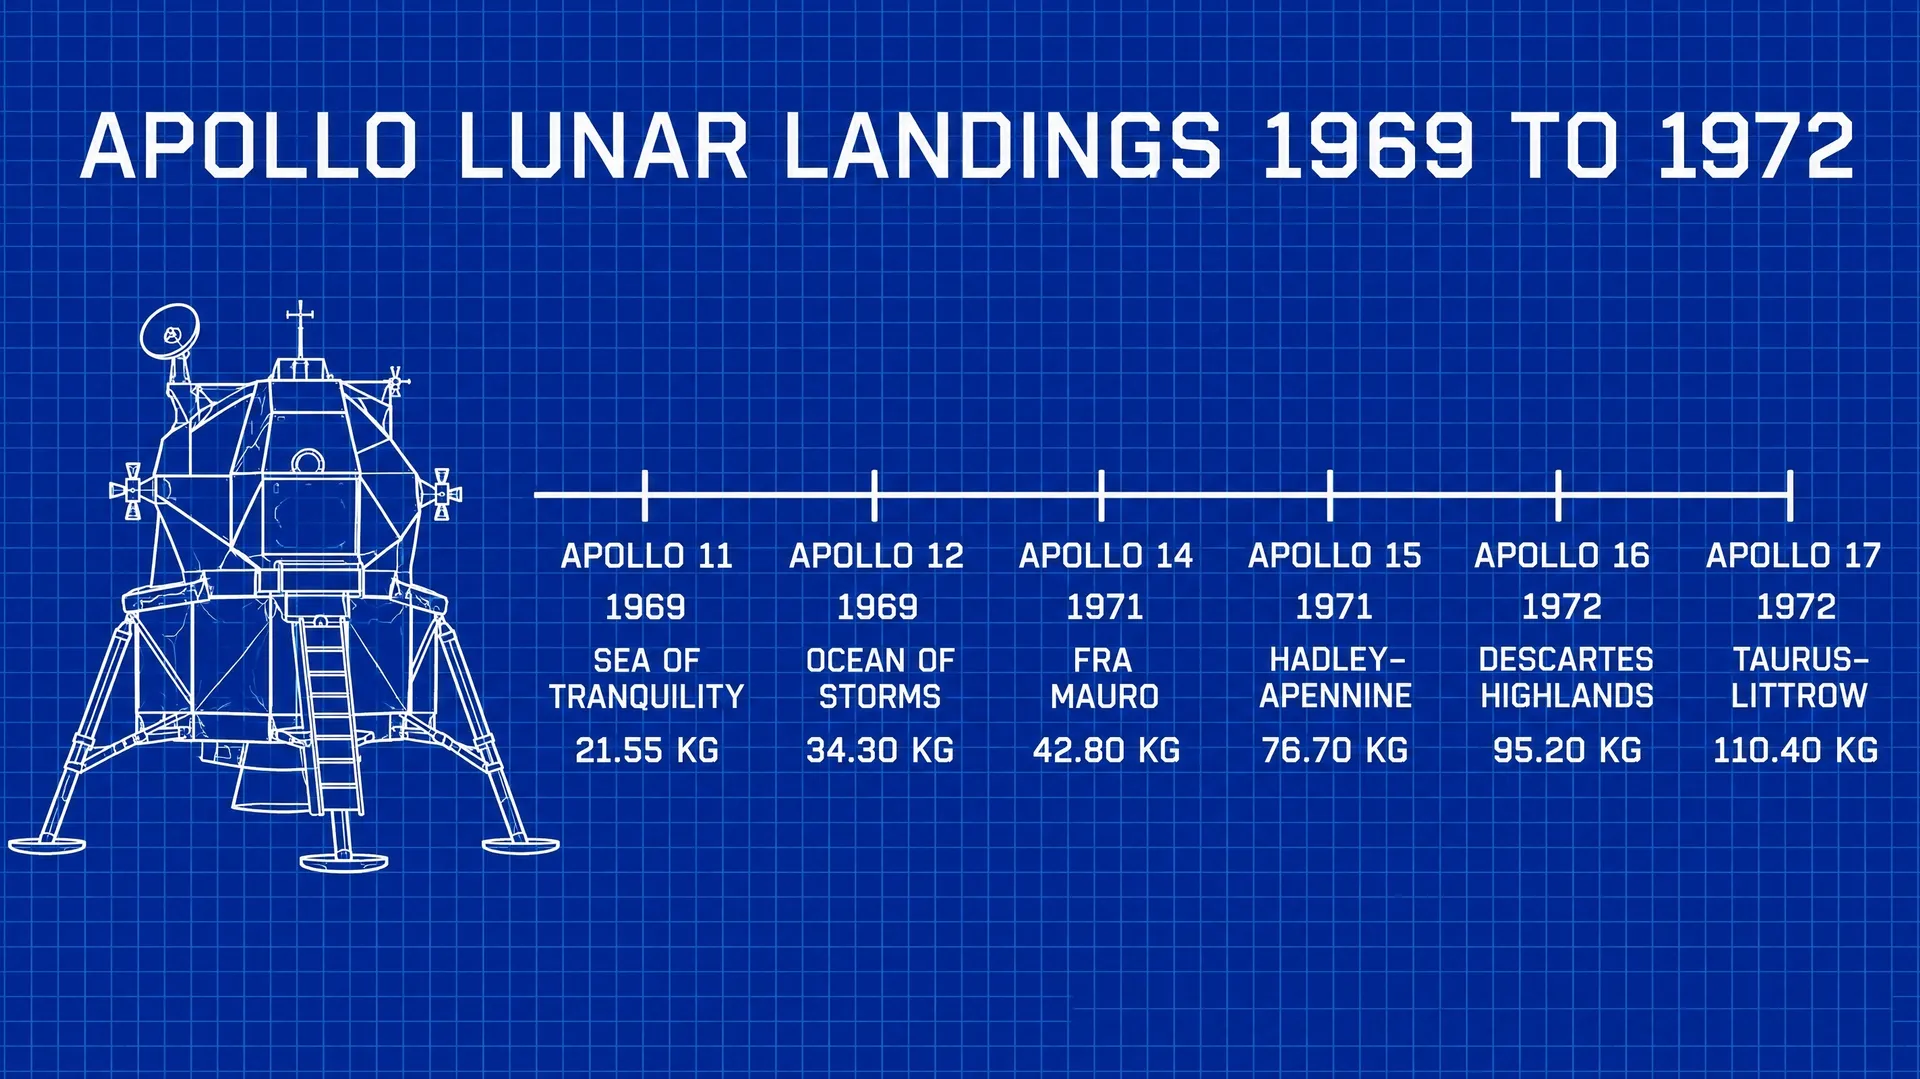
These four use the same six Apollo landings and the same sample weights, from four prompts: Swiss grid type, a 1960s space-age poster, a hand-drawn sketchnote and a technical blueprint.
How to make an infographic with AI
Image models are good at layout, illustration and type. The numbers are your part of the job, and three steps keep them right.
Collect the data first
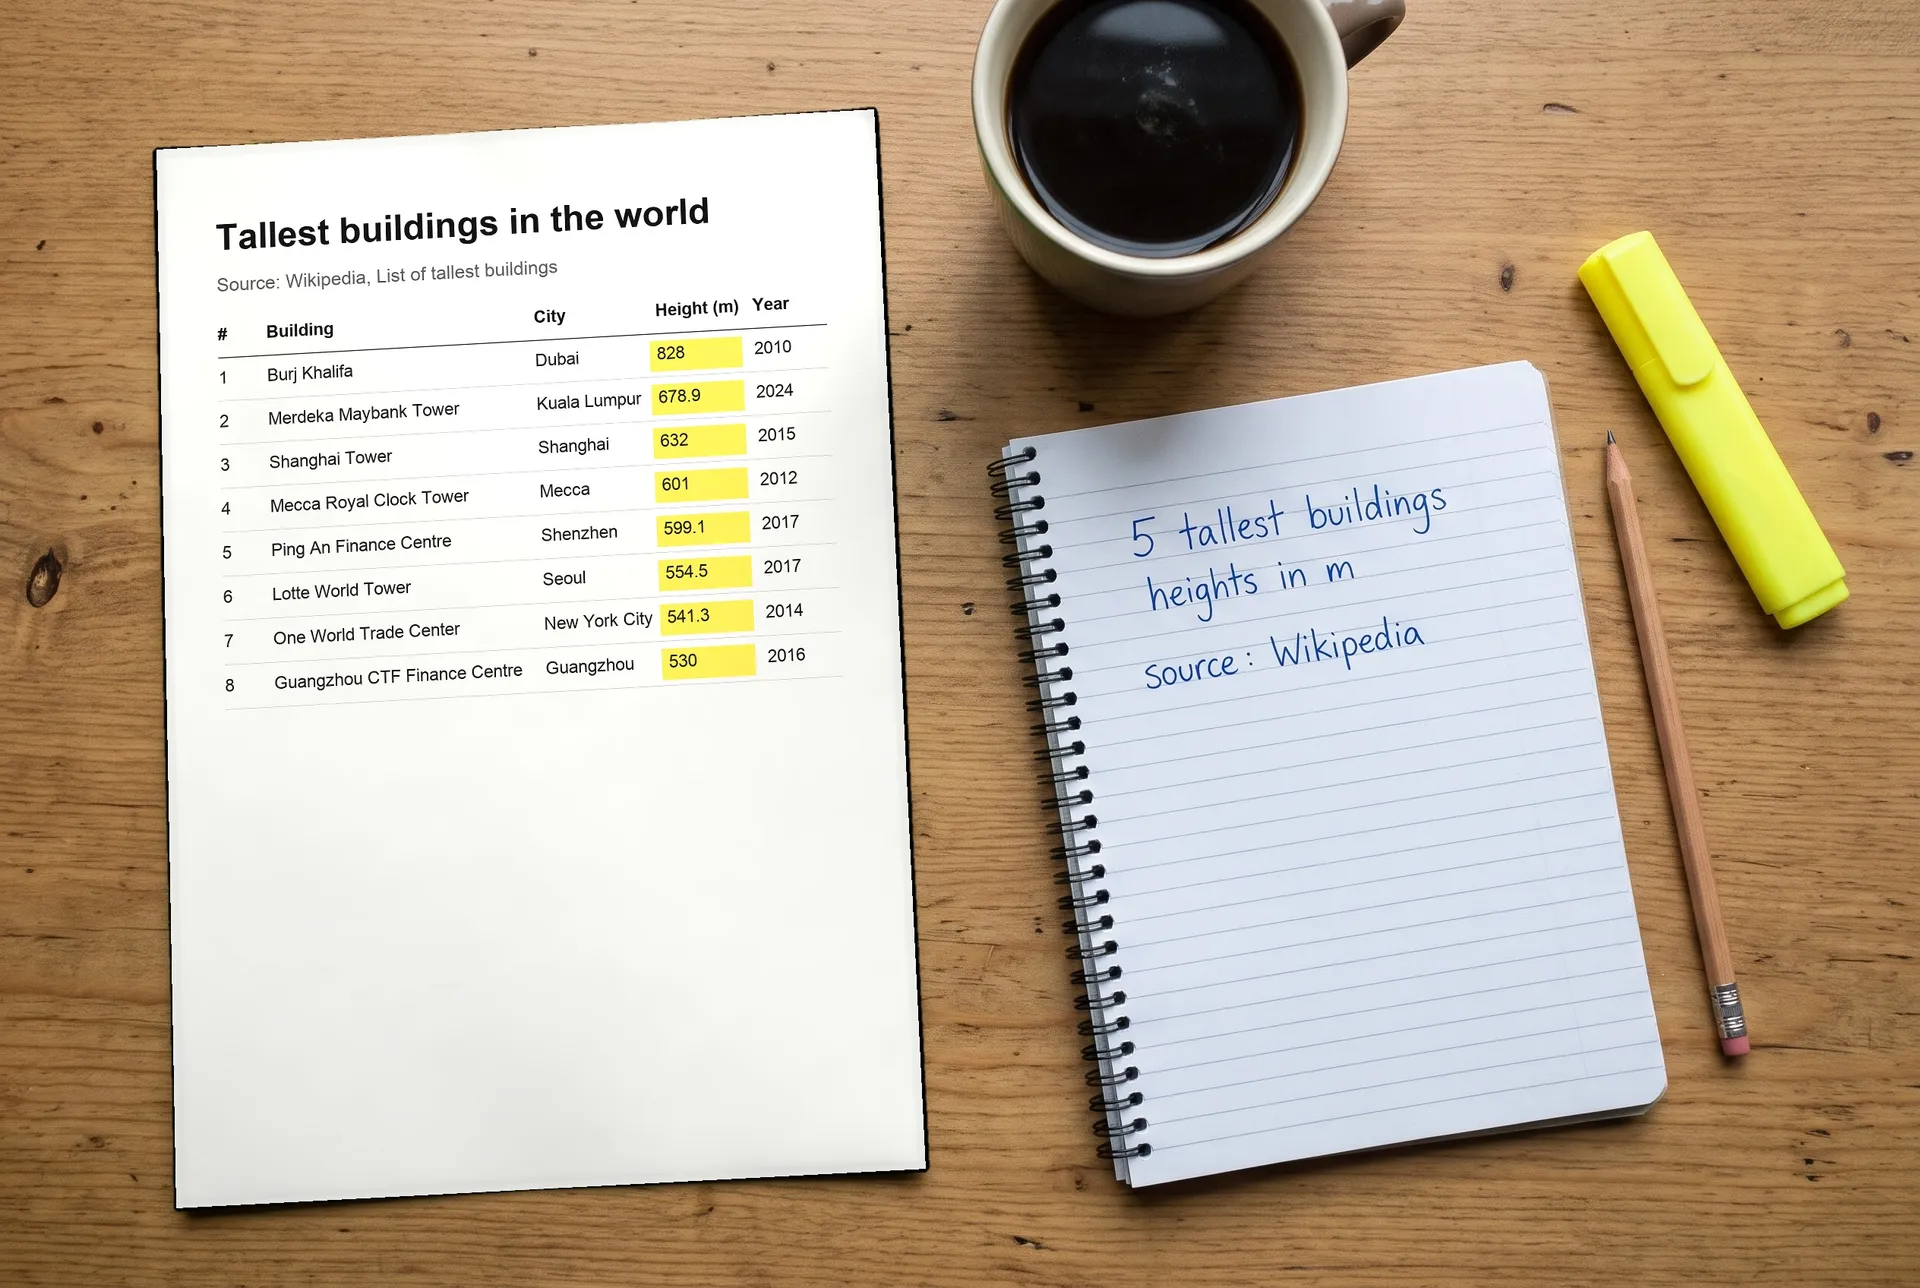
Gather the figures from a source you trust and write them down exactly, with units and the year. Don't ask the model to find or estimate numbers for you.
Put every number in the prompt
Describe the layout and the style, then write each label and figure in quotes, the way it should appear. End with "no other text" so nothing extra appears.
Check before you publish
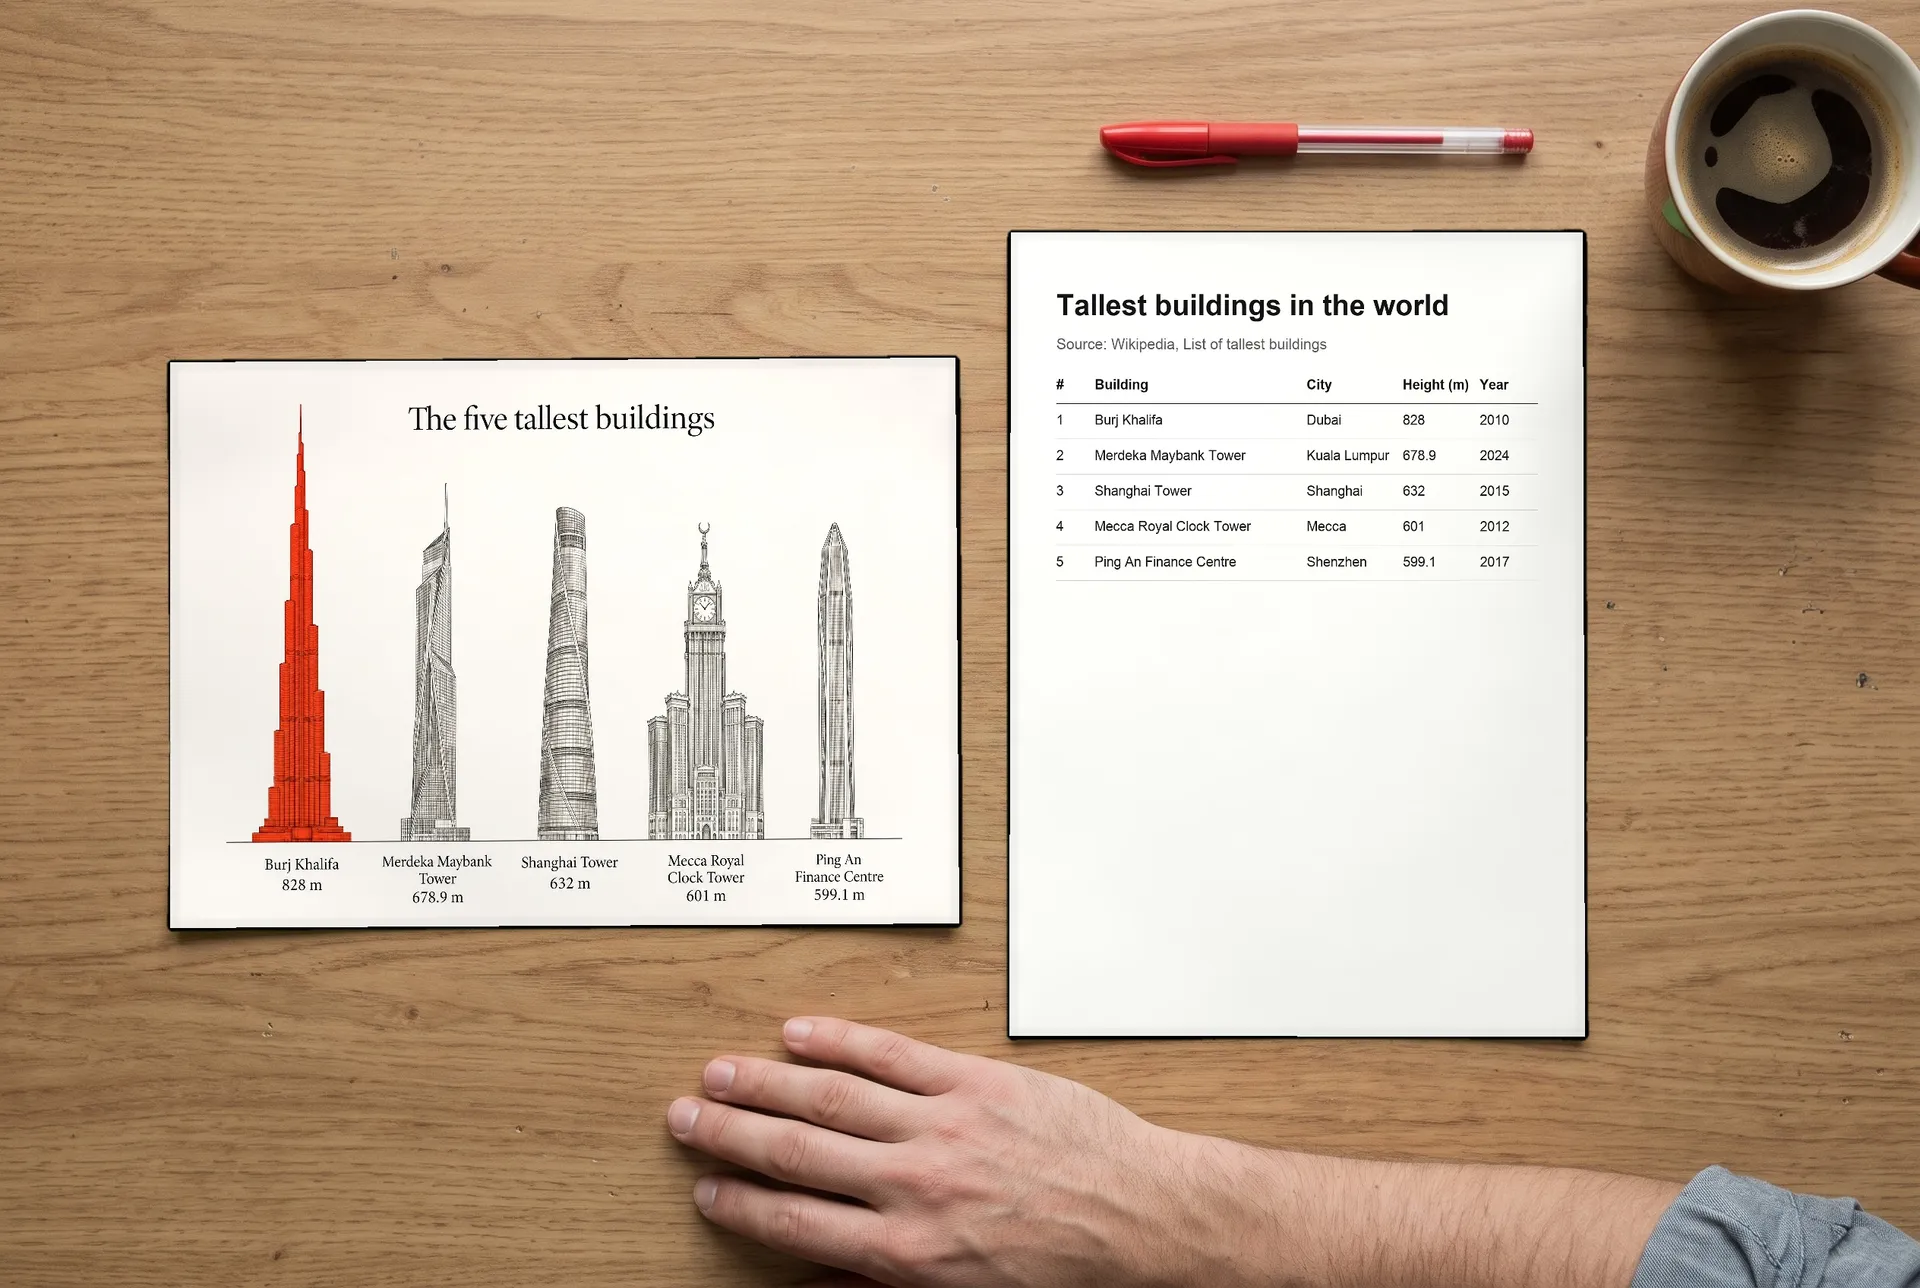
Compare every number, name and unit with your source. Models set short text well but can still change a digit, and drawn bars may not match the values, so regenerate or fix anything that's off.
AI infographic prompt examples
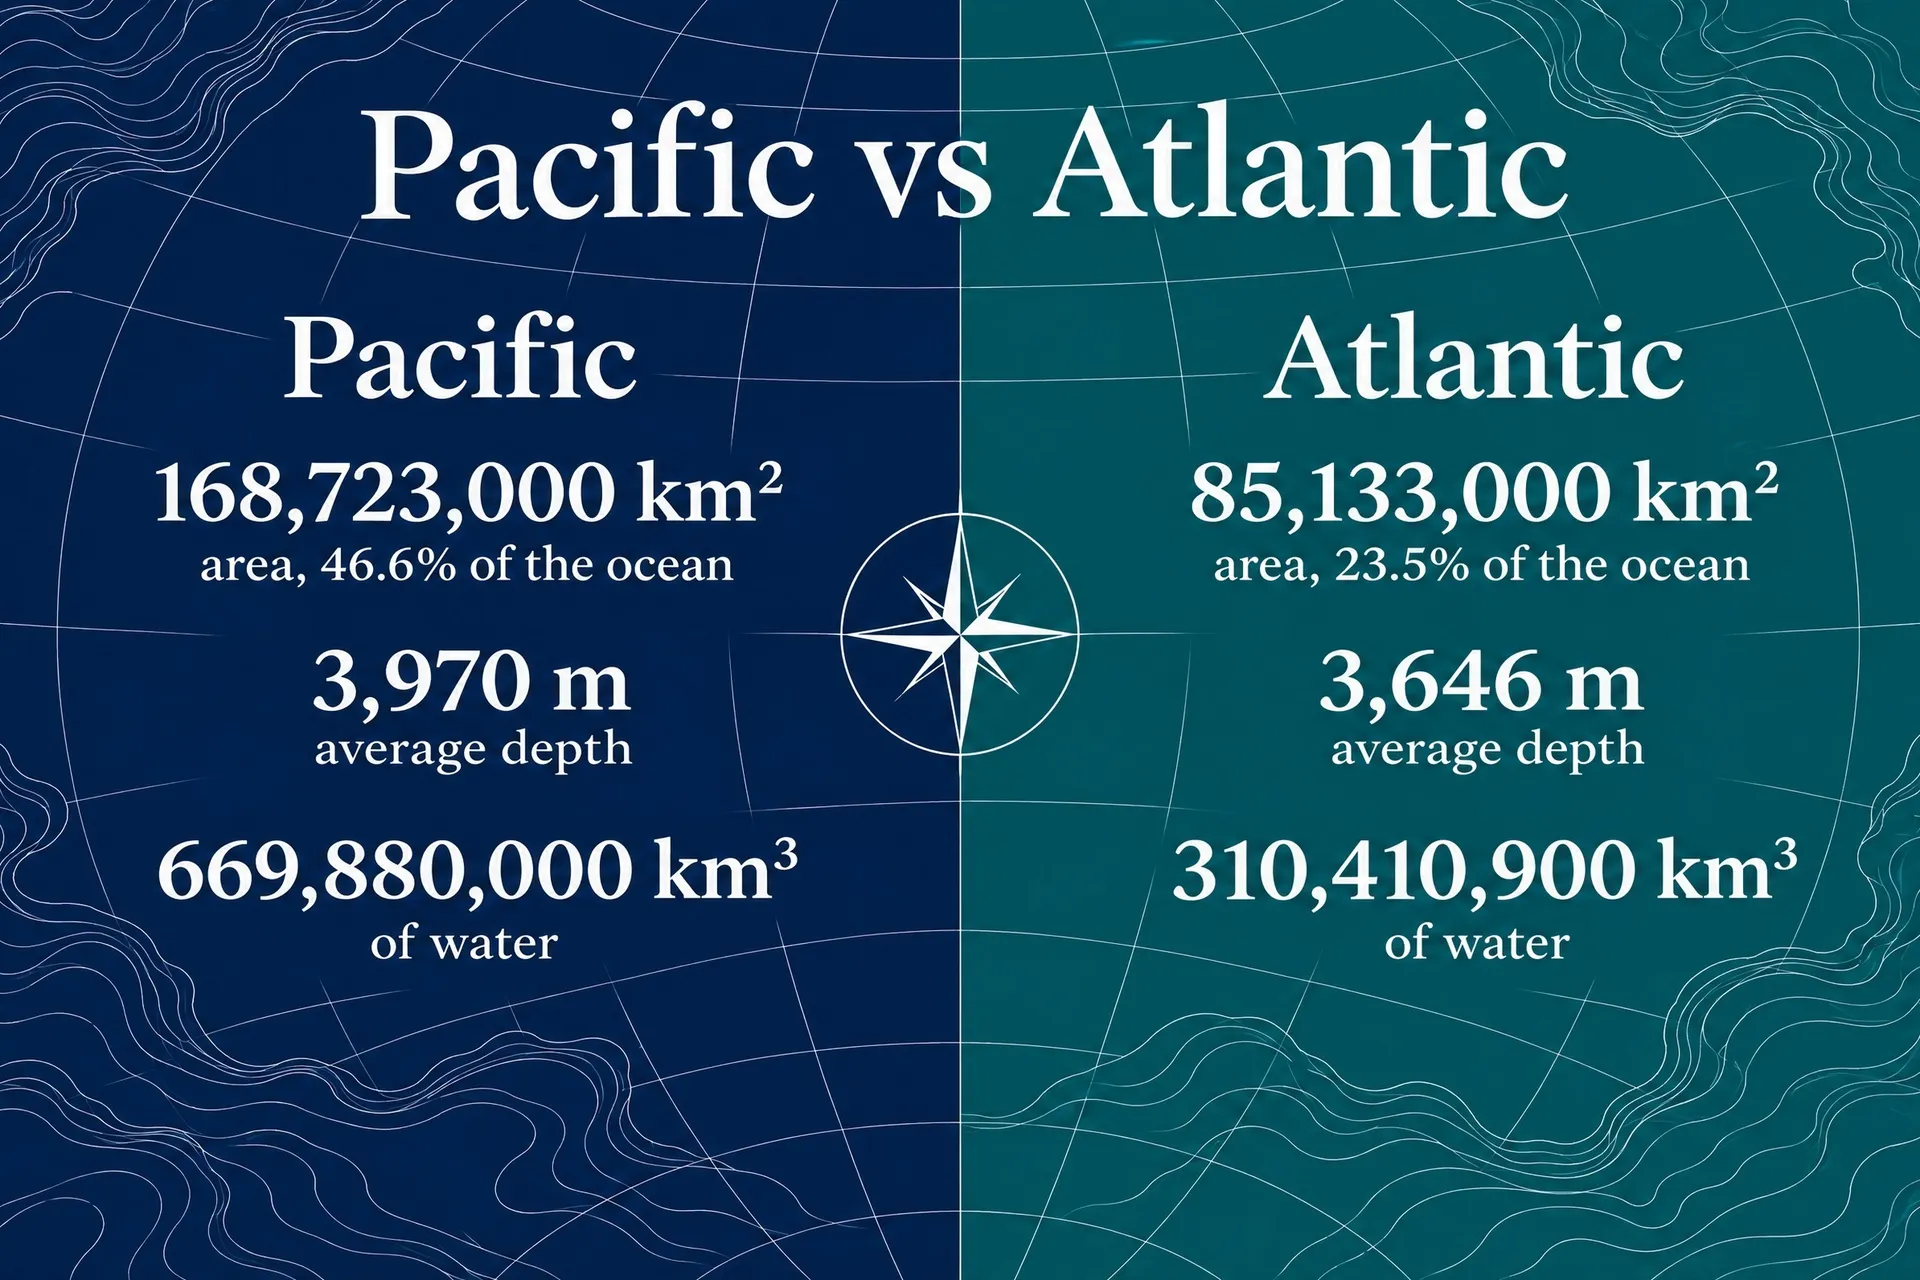
Each infographic below came from the prompt in its tab, with figures checked against Wikipedia. Copy one, swap in your own data and colors, and generate your version.
Infographics for print, slides and social posts
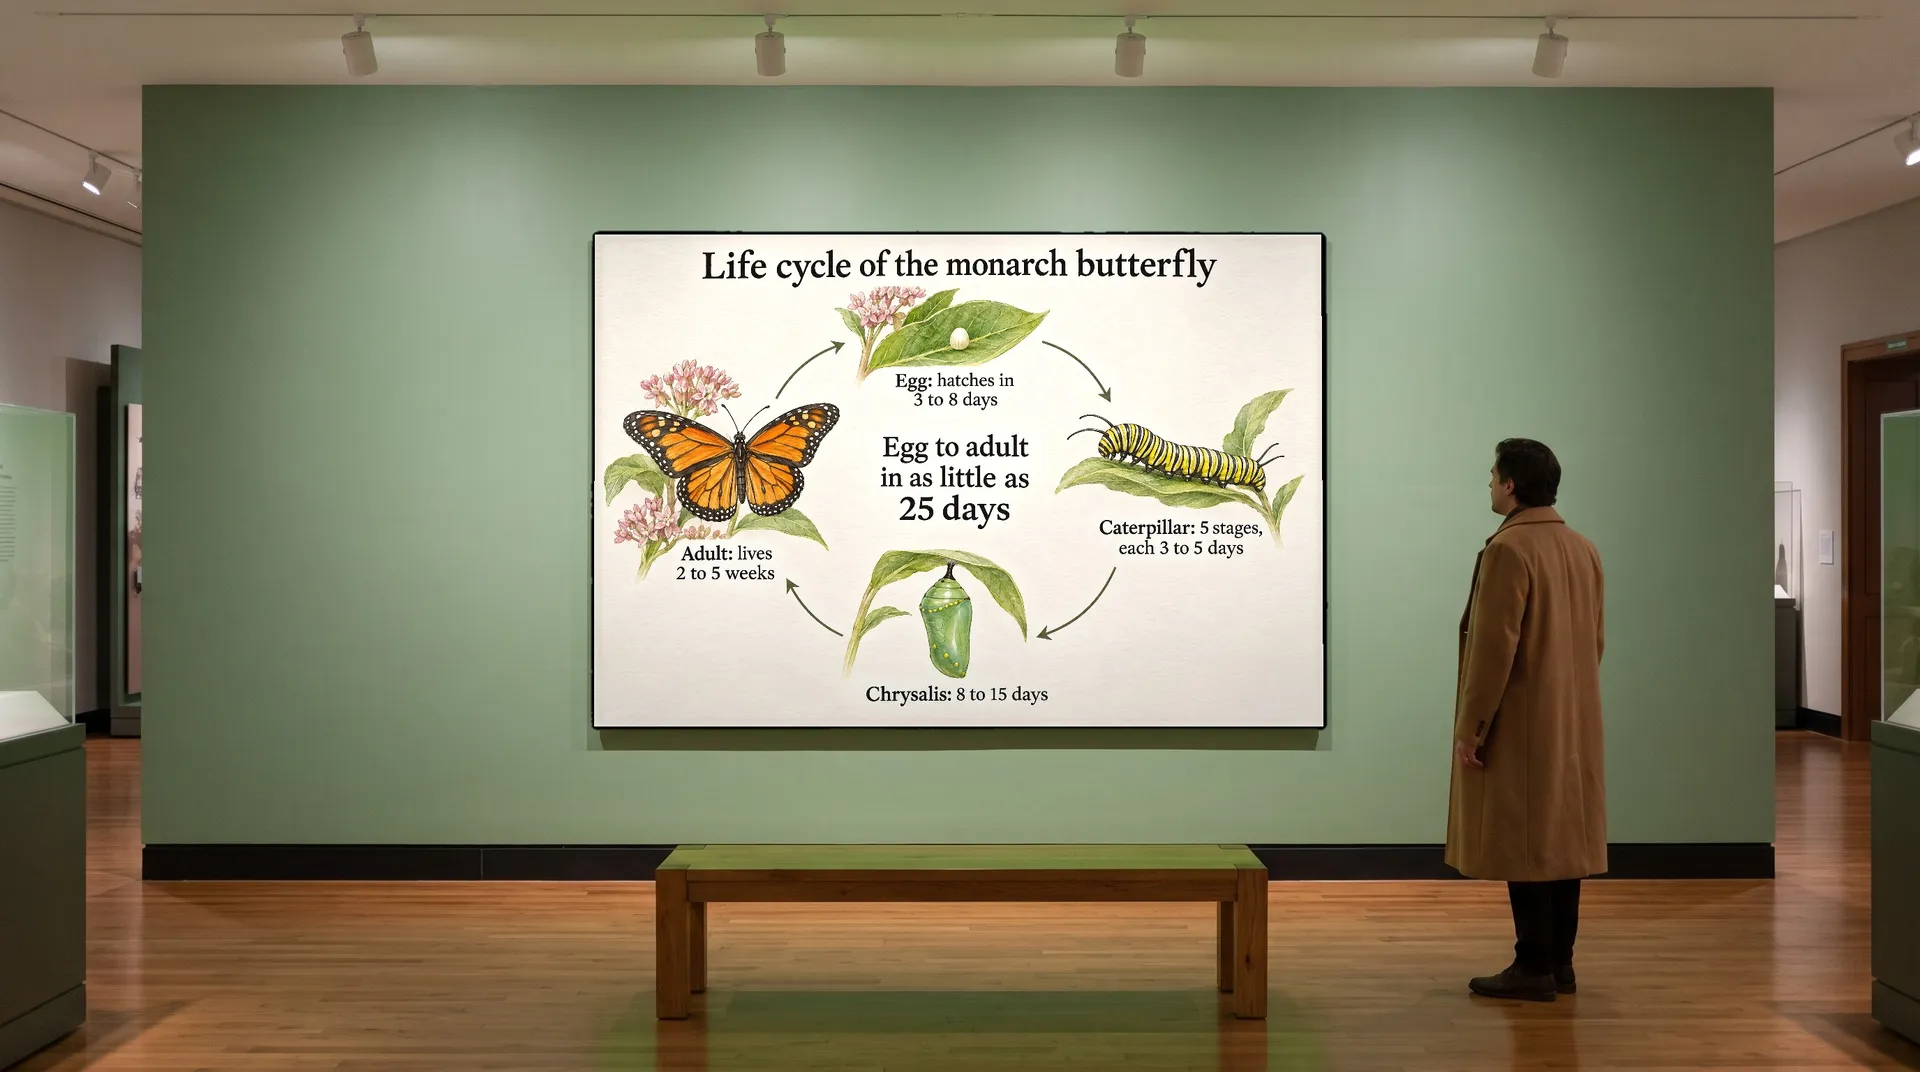
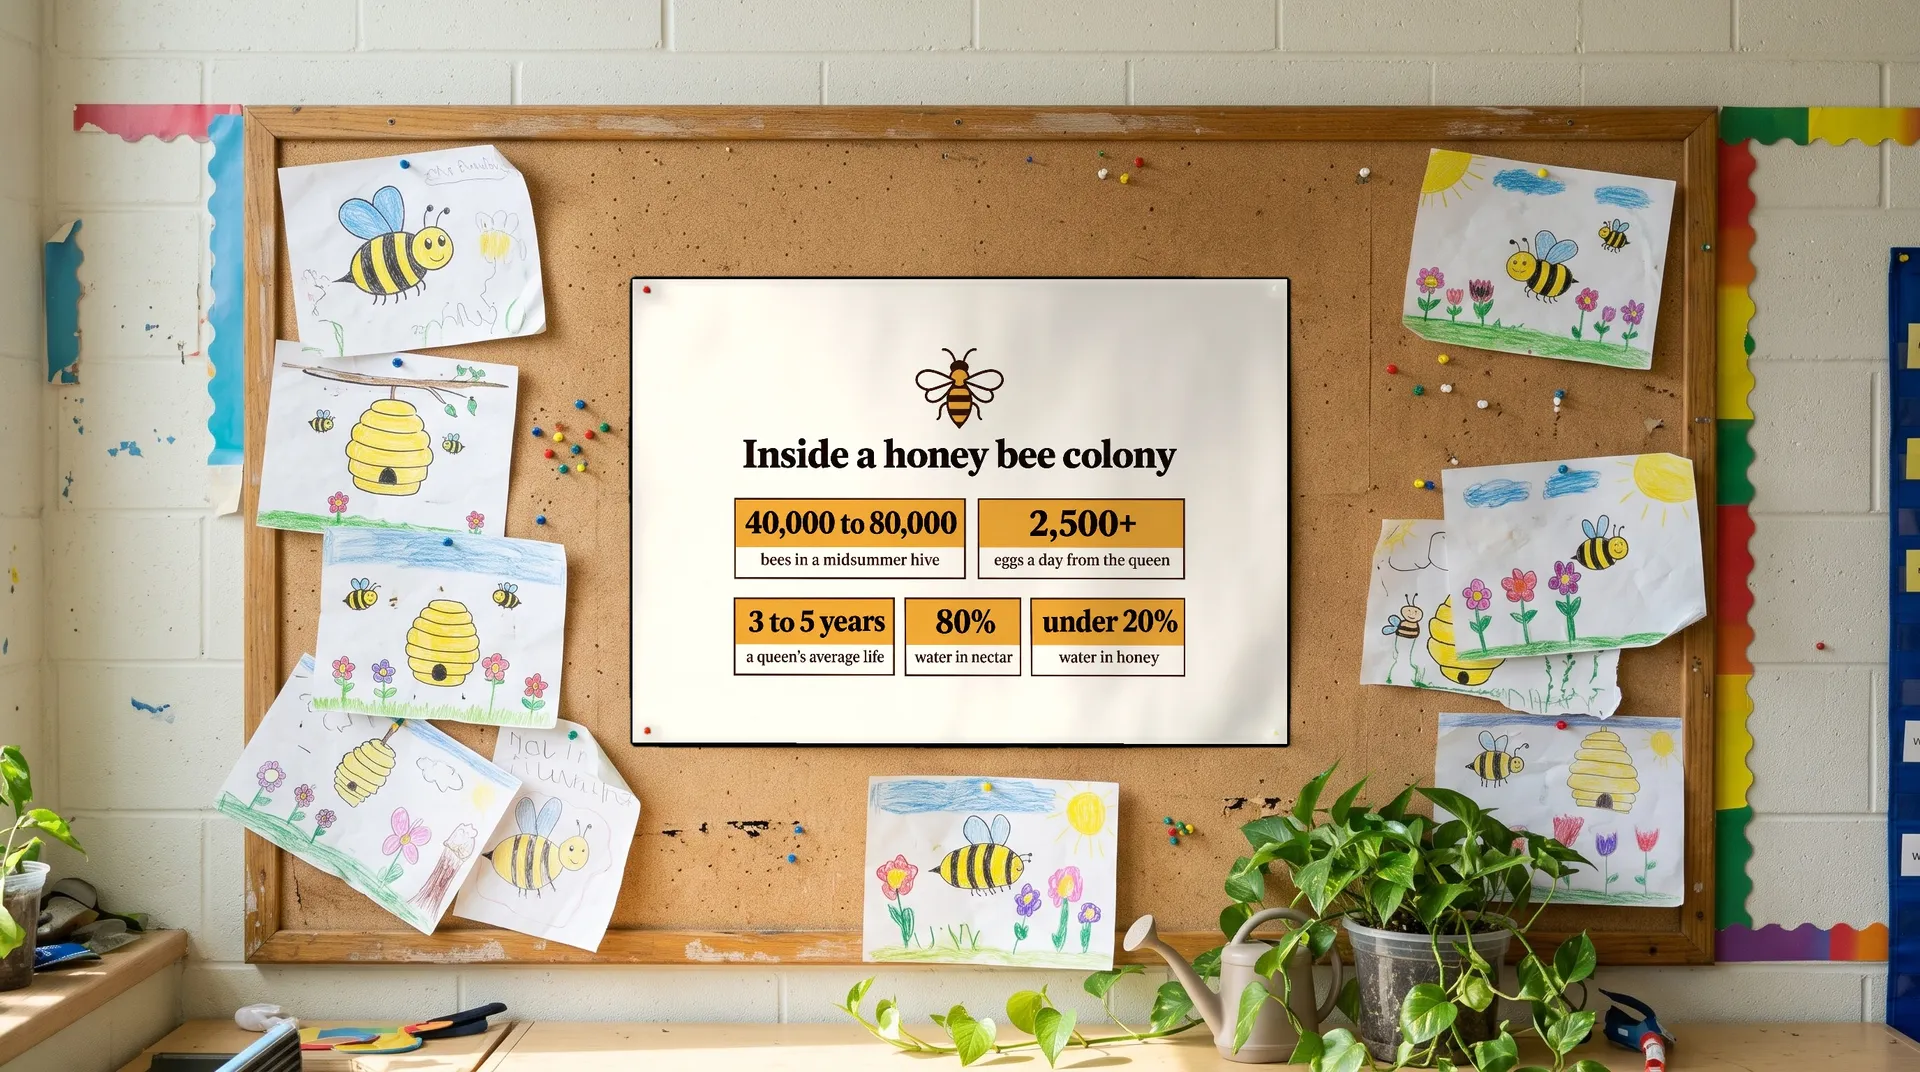
An infographic is only useful where people stop to read it. Generate it at the shape the place needs: wide for slides and wall panels, square or portrait for social posts, tall for posters.
These four infographics from higher up the page are shown where they would be used: a museum wall, a magazine page, a classroom board and a social post.


Who uses an AI infographic generator
Anyone with numbers to explain and no time to build a chart from scratch in a design tool.

More tools and guides for your brand
Frequently asked questions
Yes. Describe the layout and style, and write every label and number in the prompt exactly as it should appear. Generate a few versions, pick the clearest, then check every figure against your source. Our guide to types of AI infographics shows prompts for timelines, rankings, processes and more.
Don't rely on it. Image models can make up numbers that look plausible. Collect the data yourself from a source you trust, put it in the prompt and credit the source next to the infographic where you publish it.
The text you supply is usually set correctly, but bar lengths and other shapes are drawn, not calculated, so they may not match the values exactly. Check them, regenerate if they're off, or use a layout that shows the numbers as text, such as a ranked list, stat cards or a timeline.
Match the place it will be seen: wide for slides and wall panels, square or portrait for social posts and tall for posters. For print, you can upscale it before sending it to the printer.
Yes. Name your brand colors in the prompt, and add your logo or an earlier infographic as a reference image so new ones match the same look.
Edit the prompt and generate again, or correct a single figure in a design tool if the rest of the infographic is right. Check the new version the same way before you share it.
Images you create on paid plans come with commercial usage rights, subject to our terms and applicable third-party rights. The data you use may have its own license, so credit your source where you publish it.
Turn your numbers into an infographic
Bring the data, describe the look, pick the version that reads best, then check every figure before you share it.