Types of AI Infographics: 5 Formats, 10 Examples (& Prompts)


The best infographic ideas start with one question the numbers answer: how big, how long, which is first, or how something works. Pick the type that fits that question, such as a timeline for "when", a ranking for "which is biggest" or a process for "how". Below are five types of AI infographics with examples, the prompt behind each one, and how to make an infographic with AI on getimg.ai without getting a single number wrong.
What makes a good infographic
Infographics that get read and shared have a few things in common, whatever the topic.
Trait | Why it matters | How to get it in a prompt |
One clear question | Readers should get the point in a few seconds | Write a title that states it: "The six longest rivers" |
Real, checked data | One wrong figure undoes the whole graphic | Write every number in the prompt, exactly as it should appear |
One layout type | Mixing a timeline and a ranking confuses the eye | Name the layout: "a ranked list of six rows" |
Short labels | Long sentences don't fit and get garbled | Keep each label to a few words |
A named style | Style decides where the graphic fits | "Swiss grid", "vintage newspaper", "field guide watercolor" |
A credited source | Readers trust figures they can trace | Credit the source in the caption or post next to the graphic |
All the examples in this post use figures from Wikipedia, copied exactly and checked in every image.
How to make an infographic with AI
1. Collect the data first
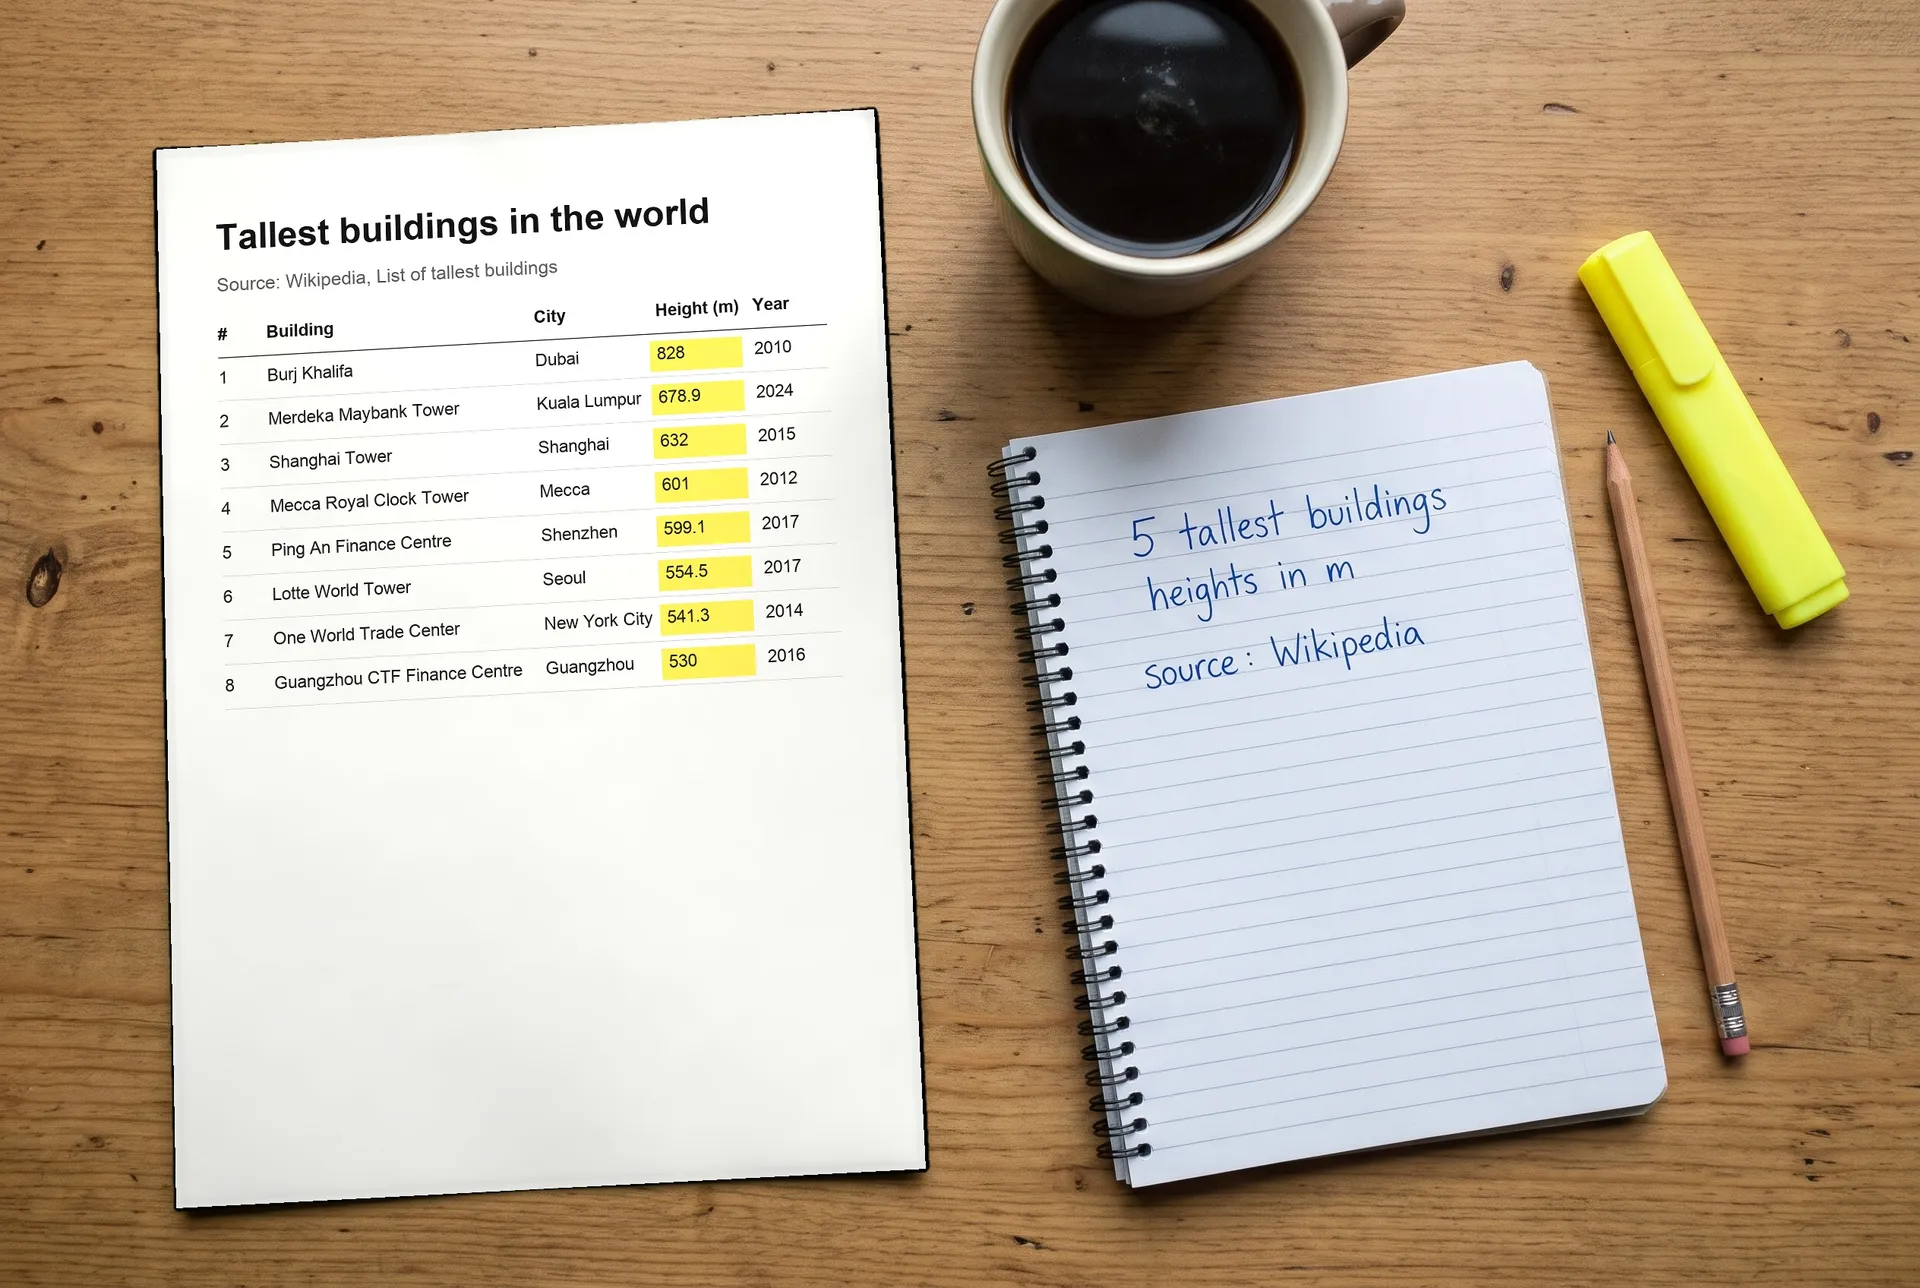
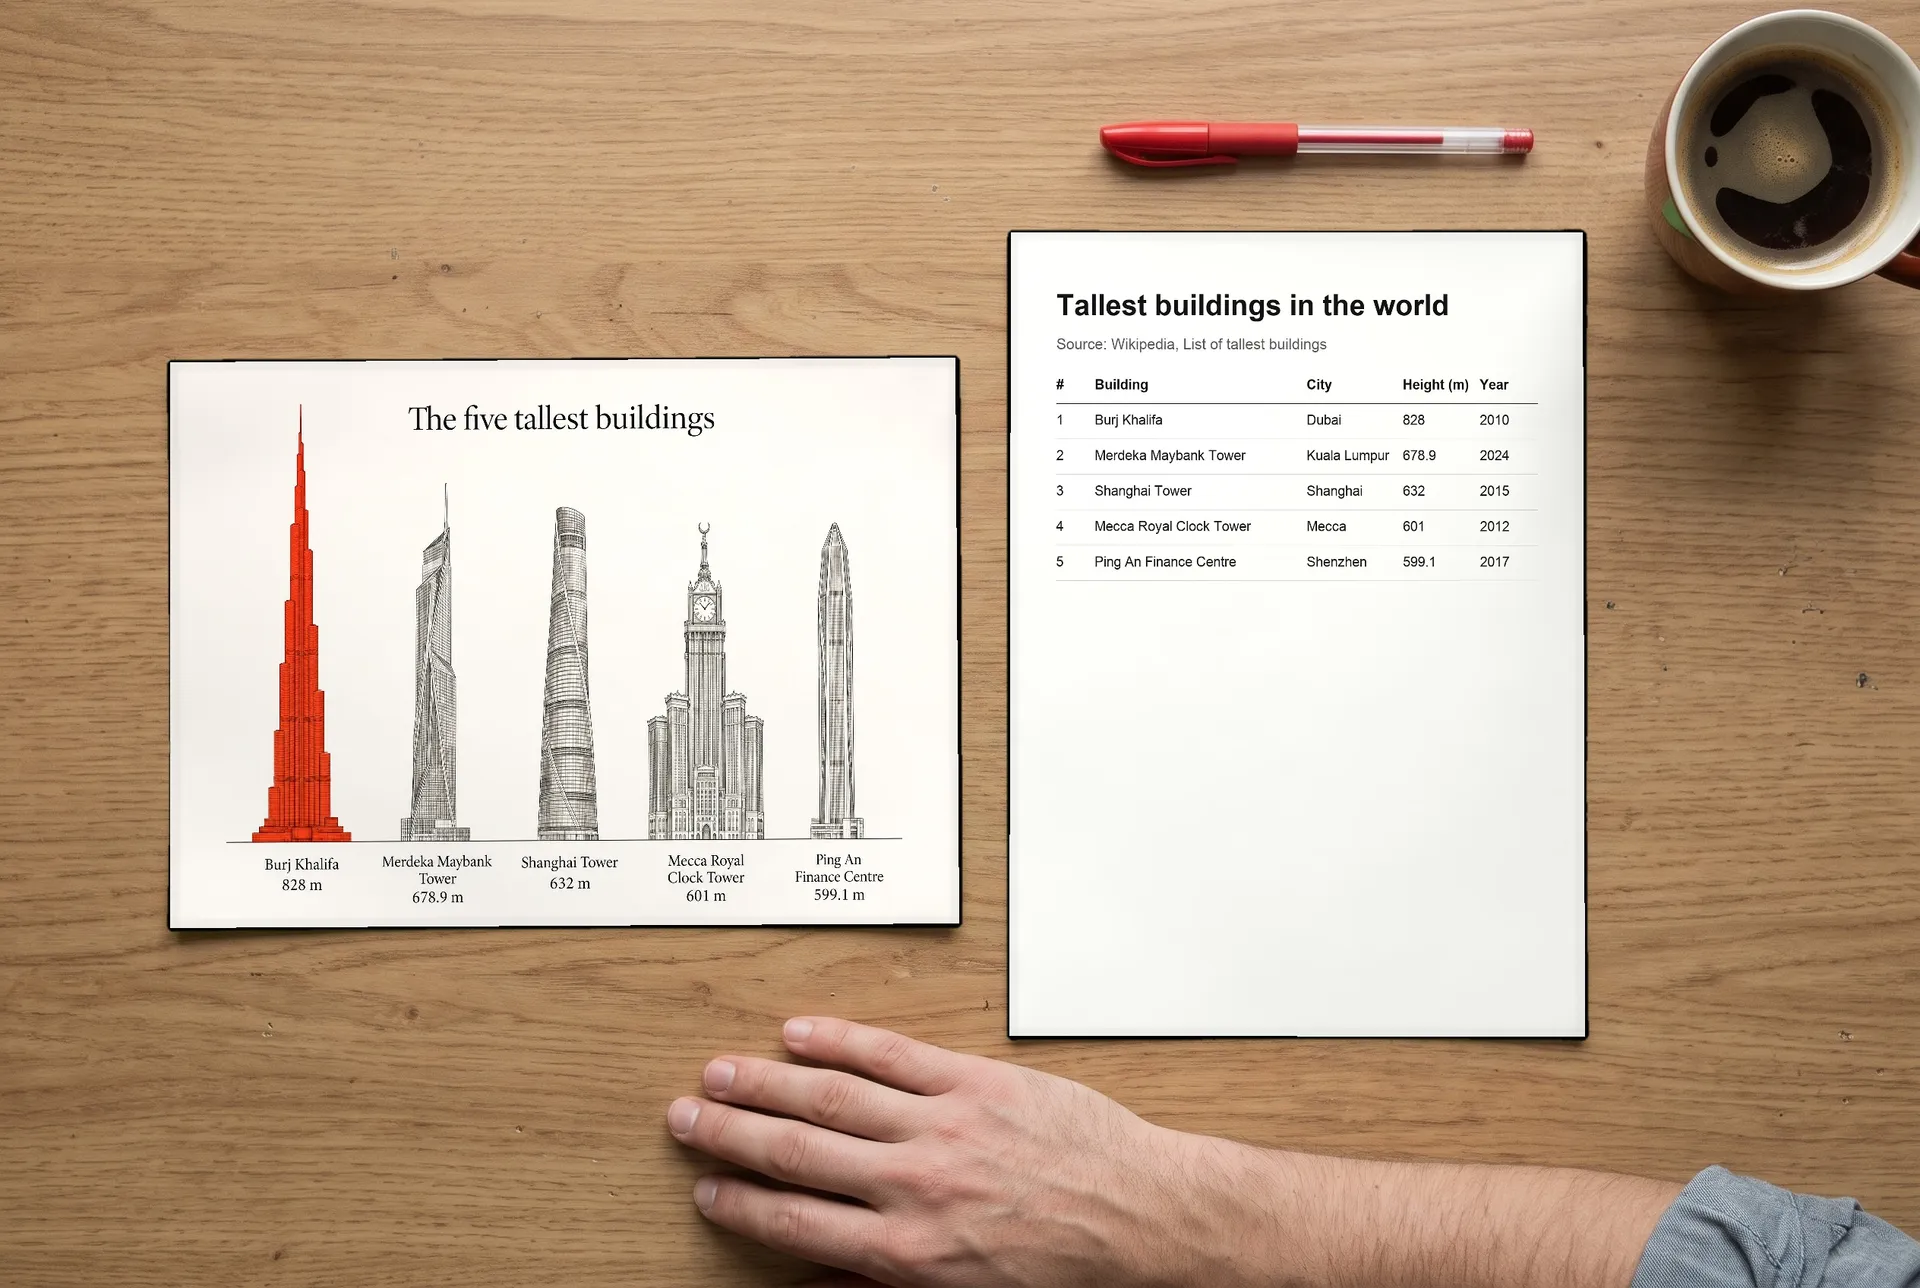
Gather the figures from a source you trust and write them down with units and the year. Don't ask an image model to find or estimate numbers. It can produce figures that look right and aren't. For the tallest buildings example on our AI infographic generator page, the heights came from a Wikipedia table, written down before anything was generated.
2. Pick the infographic type
Match the type to the question:
- Statistics, for "how many" or "how much"
- Timeline, for "when" and "in what order"
- Comparison, for "how do these two differ"
- Process, for "how does it work"
- Ranking, for "which is biggest, longest or first"
Five to seven data points is a good amount for one infographic. More than that, and the type gets too small to read on a phone.
3. Write the prompt with every label in quotes
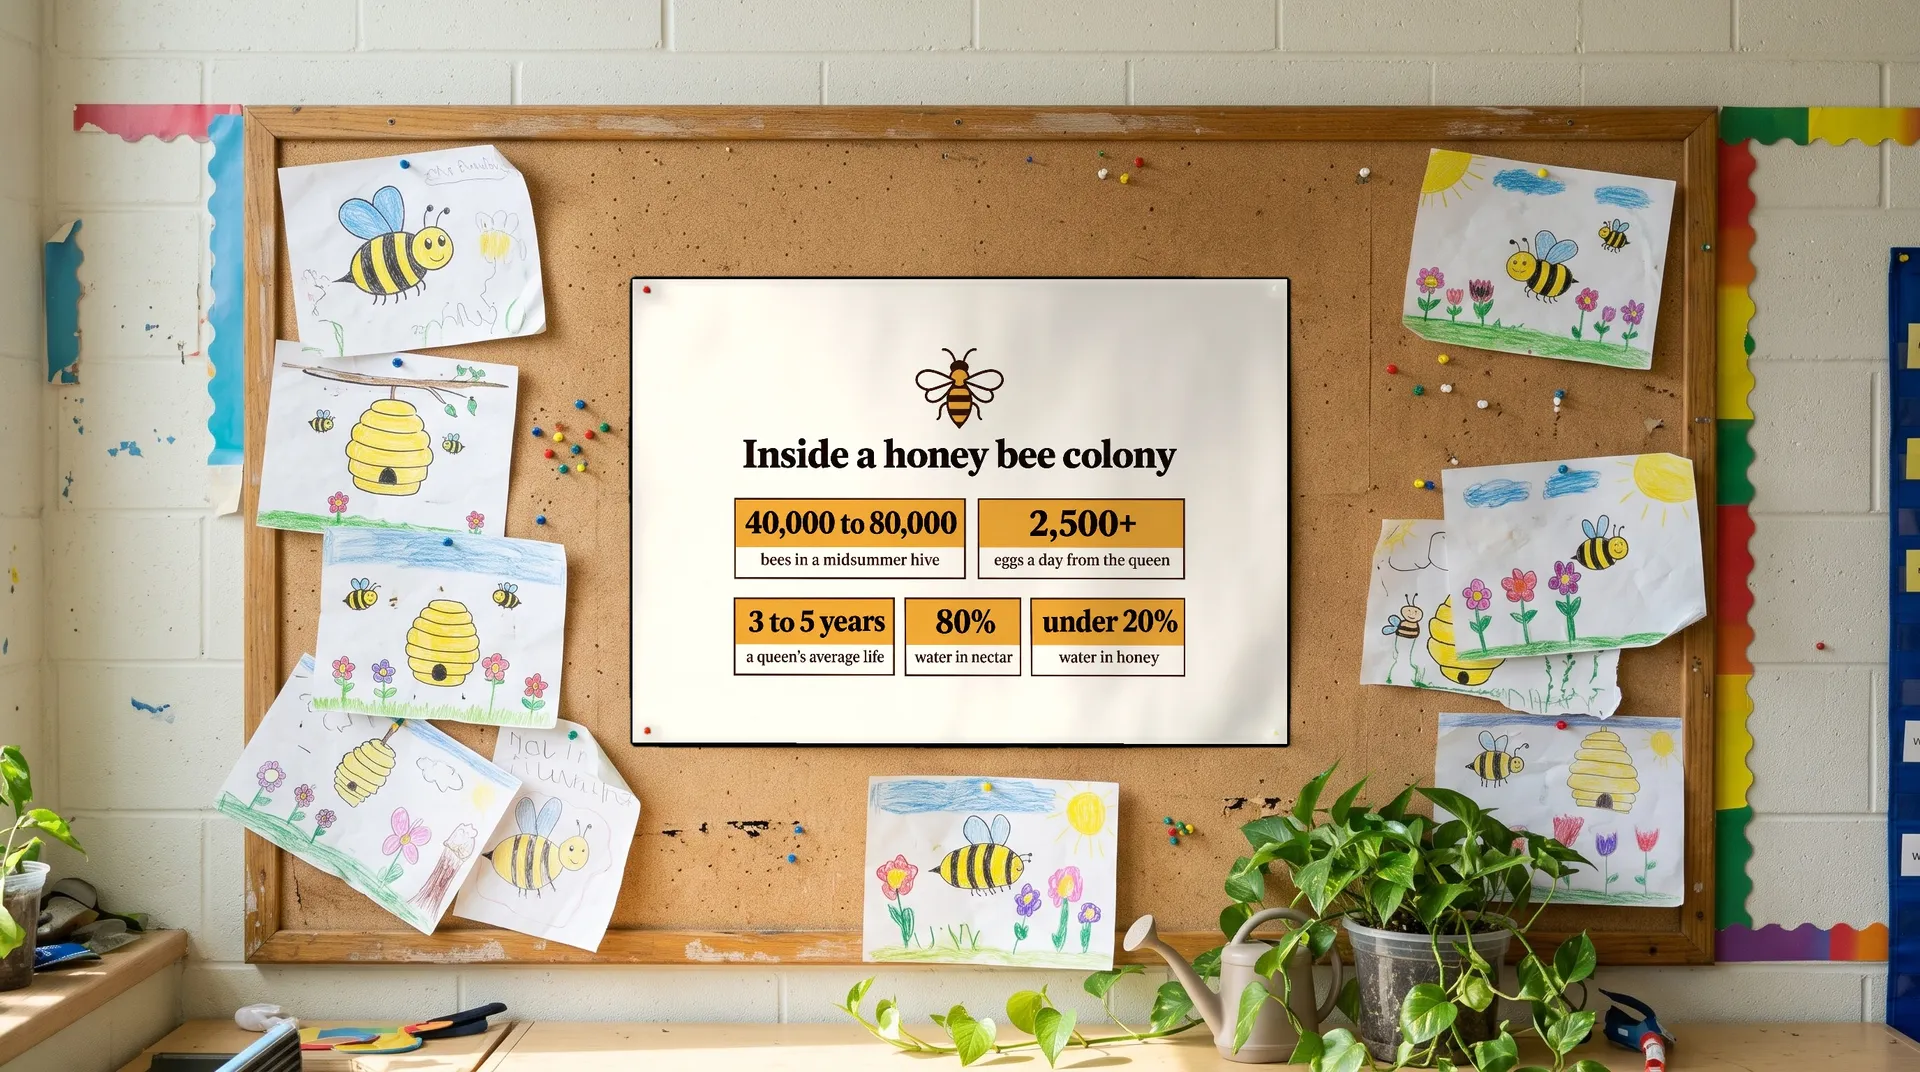
Describe the layout, the style and the colors, then write each title, label and figure in quotes, the way it should appear. Then say what you don't want. This is the prompt behind the honey bee stat sheet:
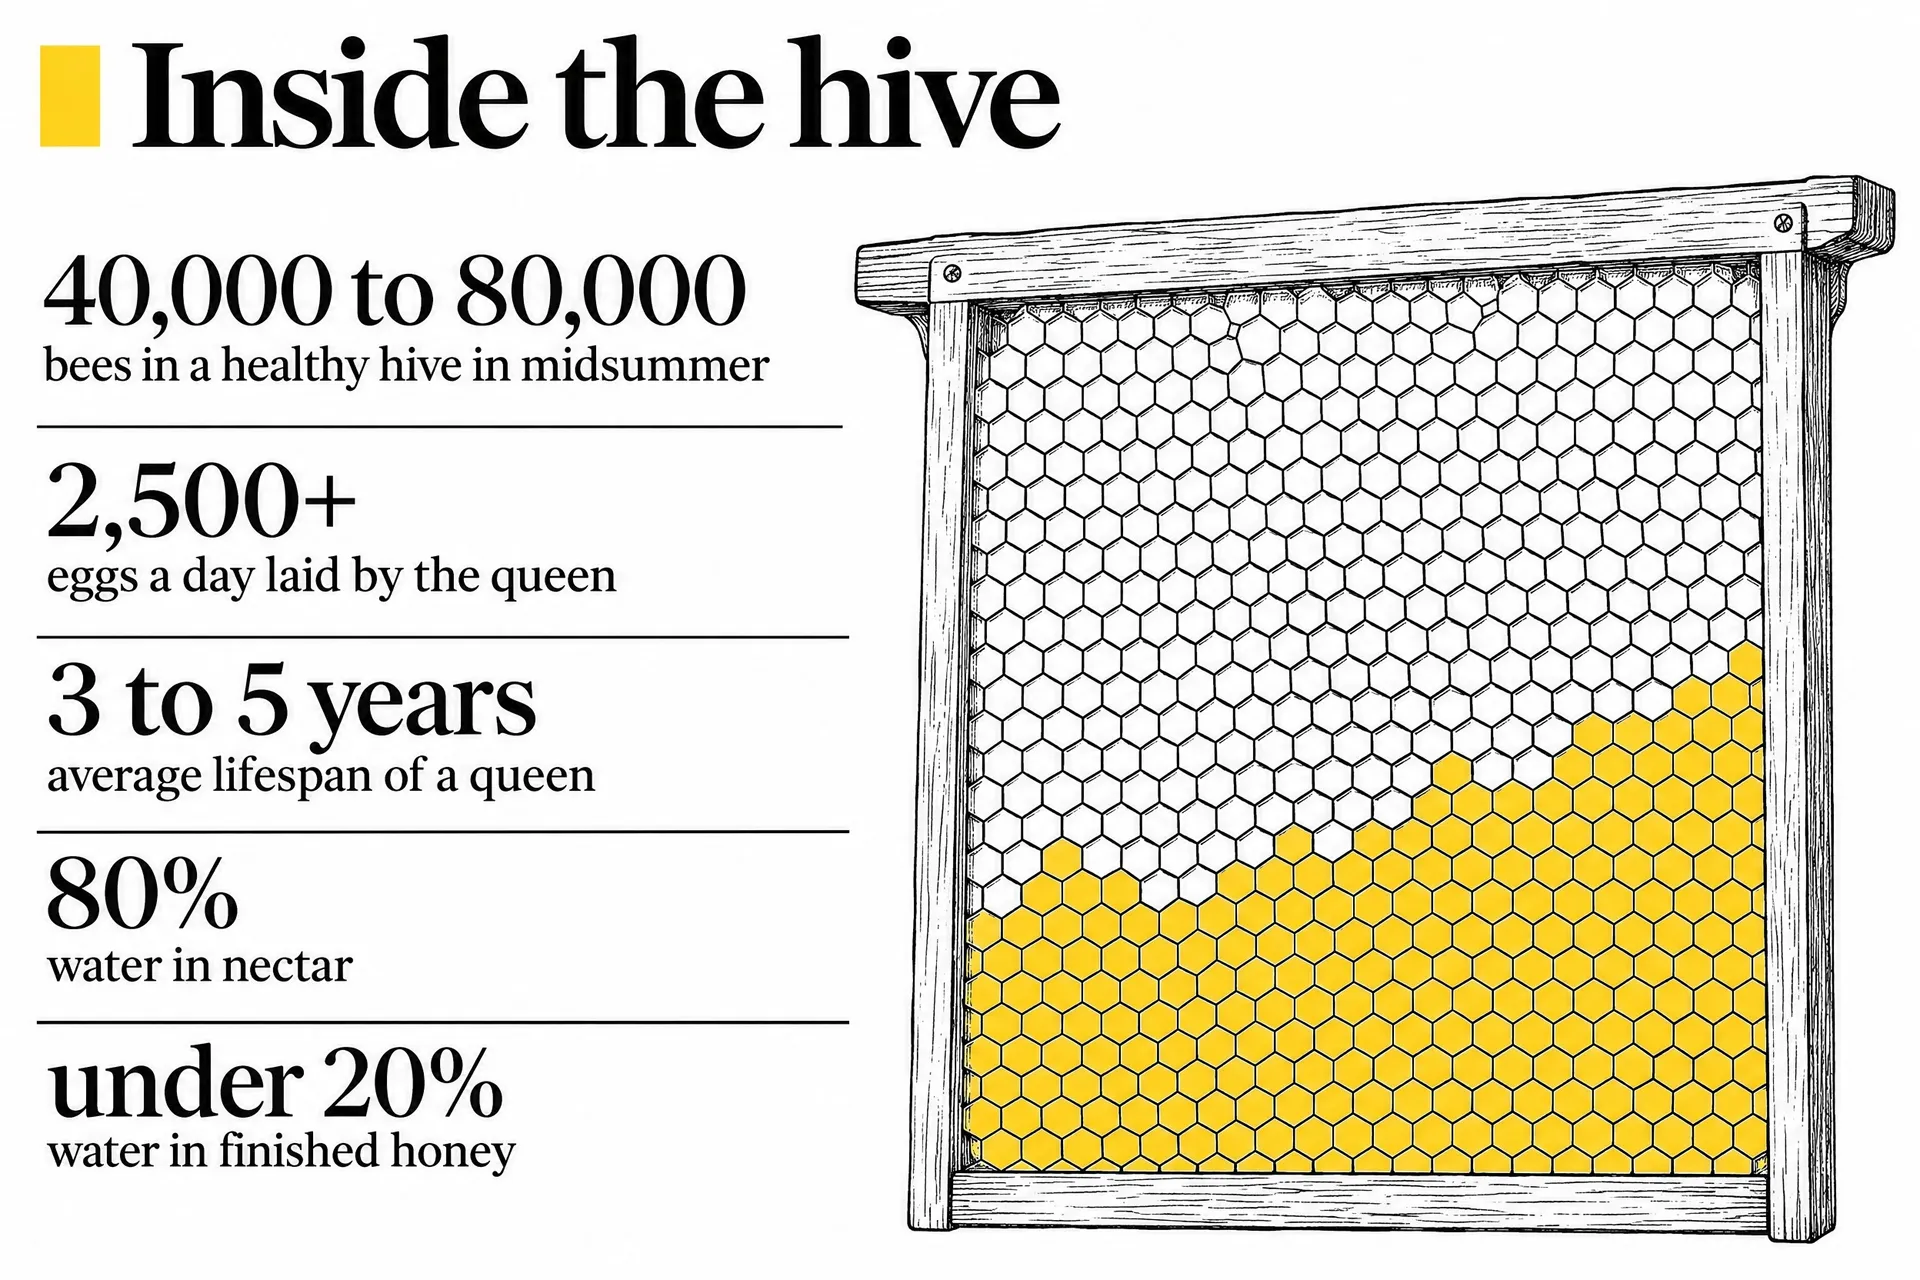
Landscape stat sheet infographic in a clean editorial style on cream with honey amber, deep brown and black. All content sits in the central area with very wide empty margins of at least 18 percent on the left and right and 12 percent at top and bottom. A small flat line honey bee at the top center, title below it in a bold serif: "Inside a honey bee colony". Below, a compact grid of five stat blocks, each a large number and a short line: "40,000 to 80,000" "bees in a midsummer hive"; "2,500+" "eggs a day from the queen"; "3 to 5 years" "a queen's average life"; "80%" "water in nectar"; "under 20%" "water in honey". No other text, no footer, no gradients, no 3D, no decorative dashes, sparkles or motion lines.
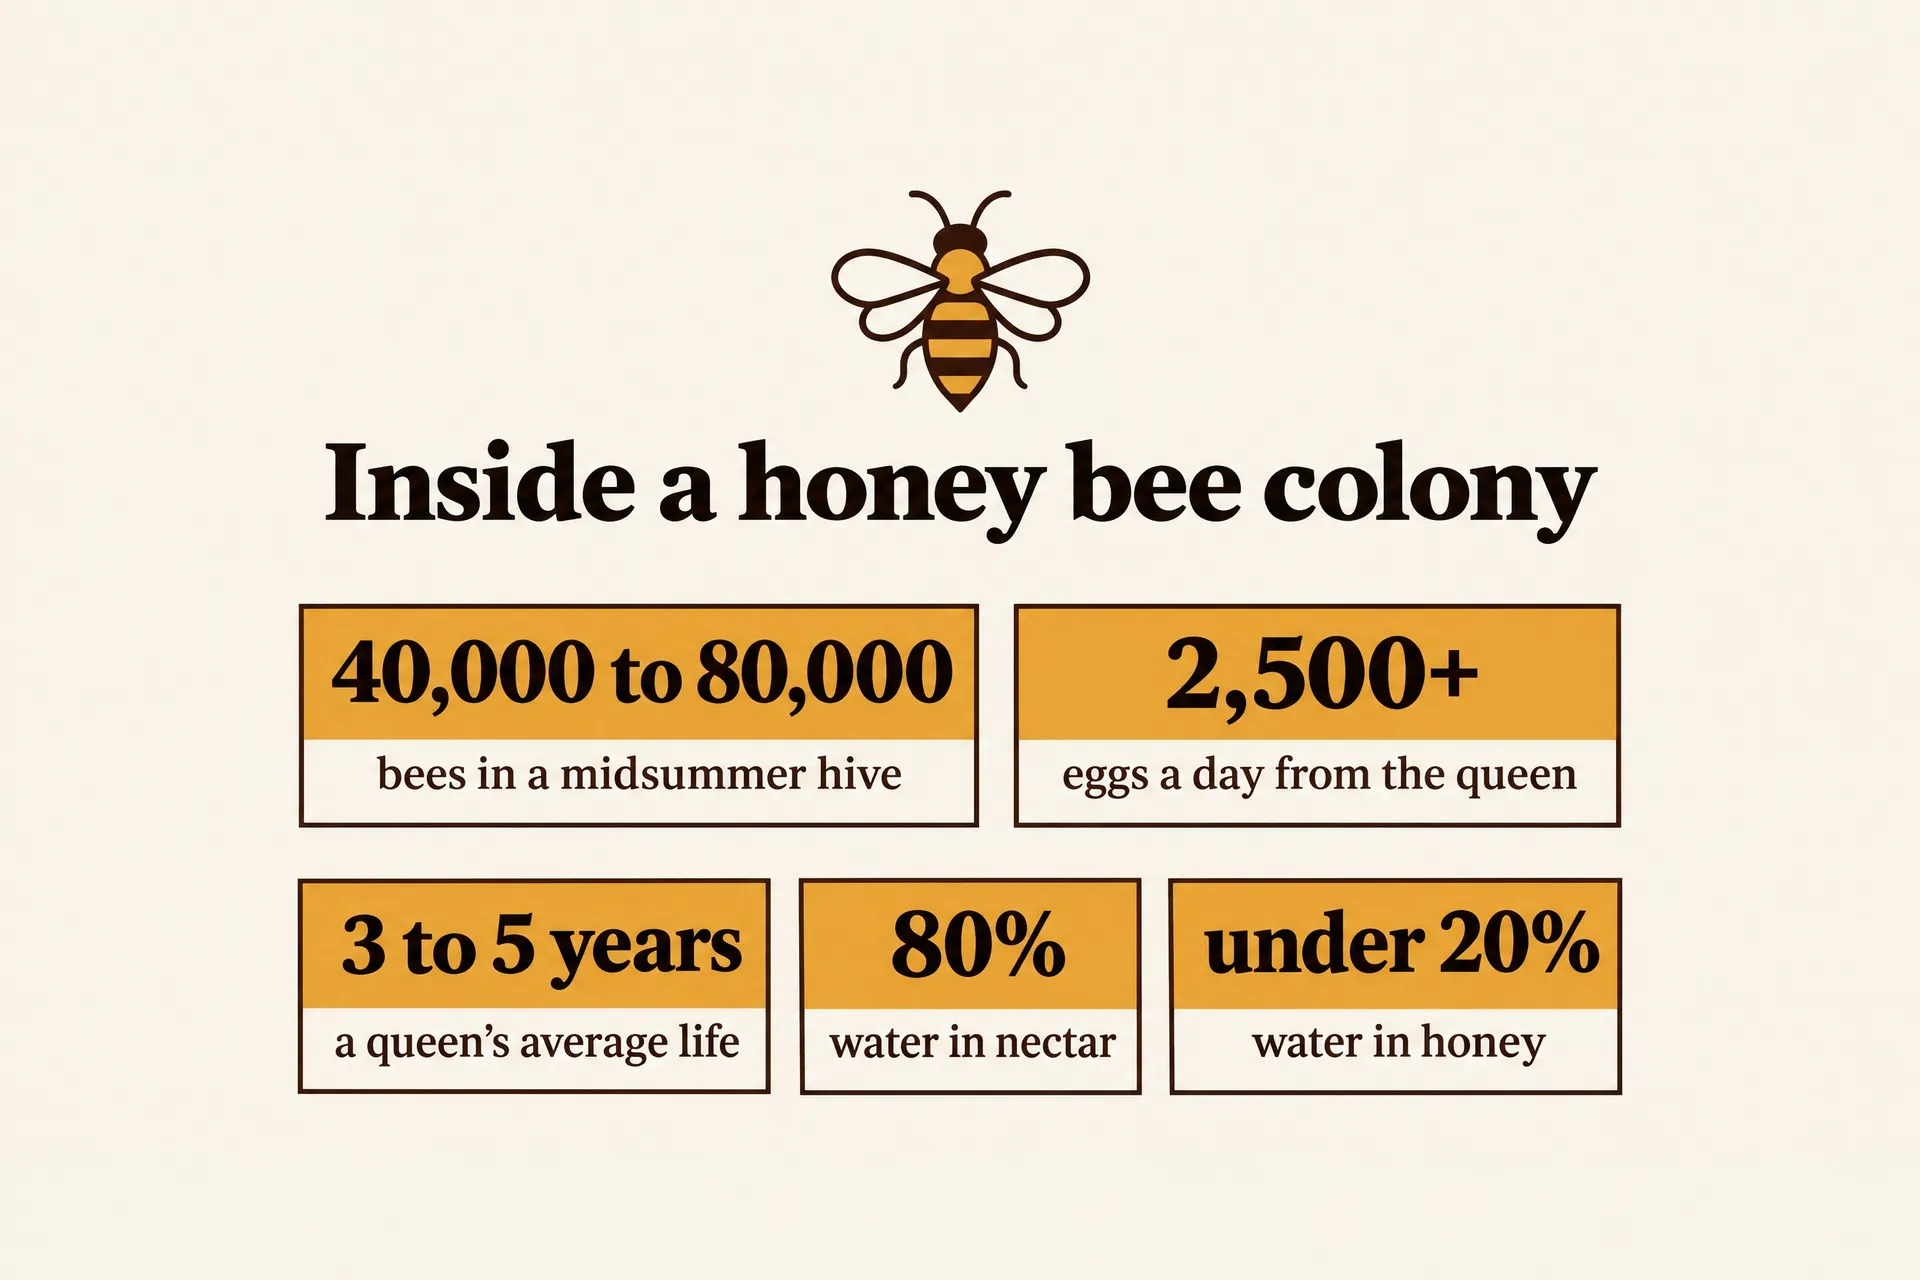
End the prompt with "no other text". It stops the model from adding made-up subtitles, extra numbers or filler labels.
4. Generate a few versions and pick the clearest
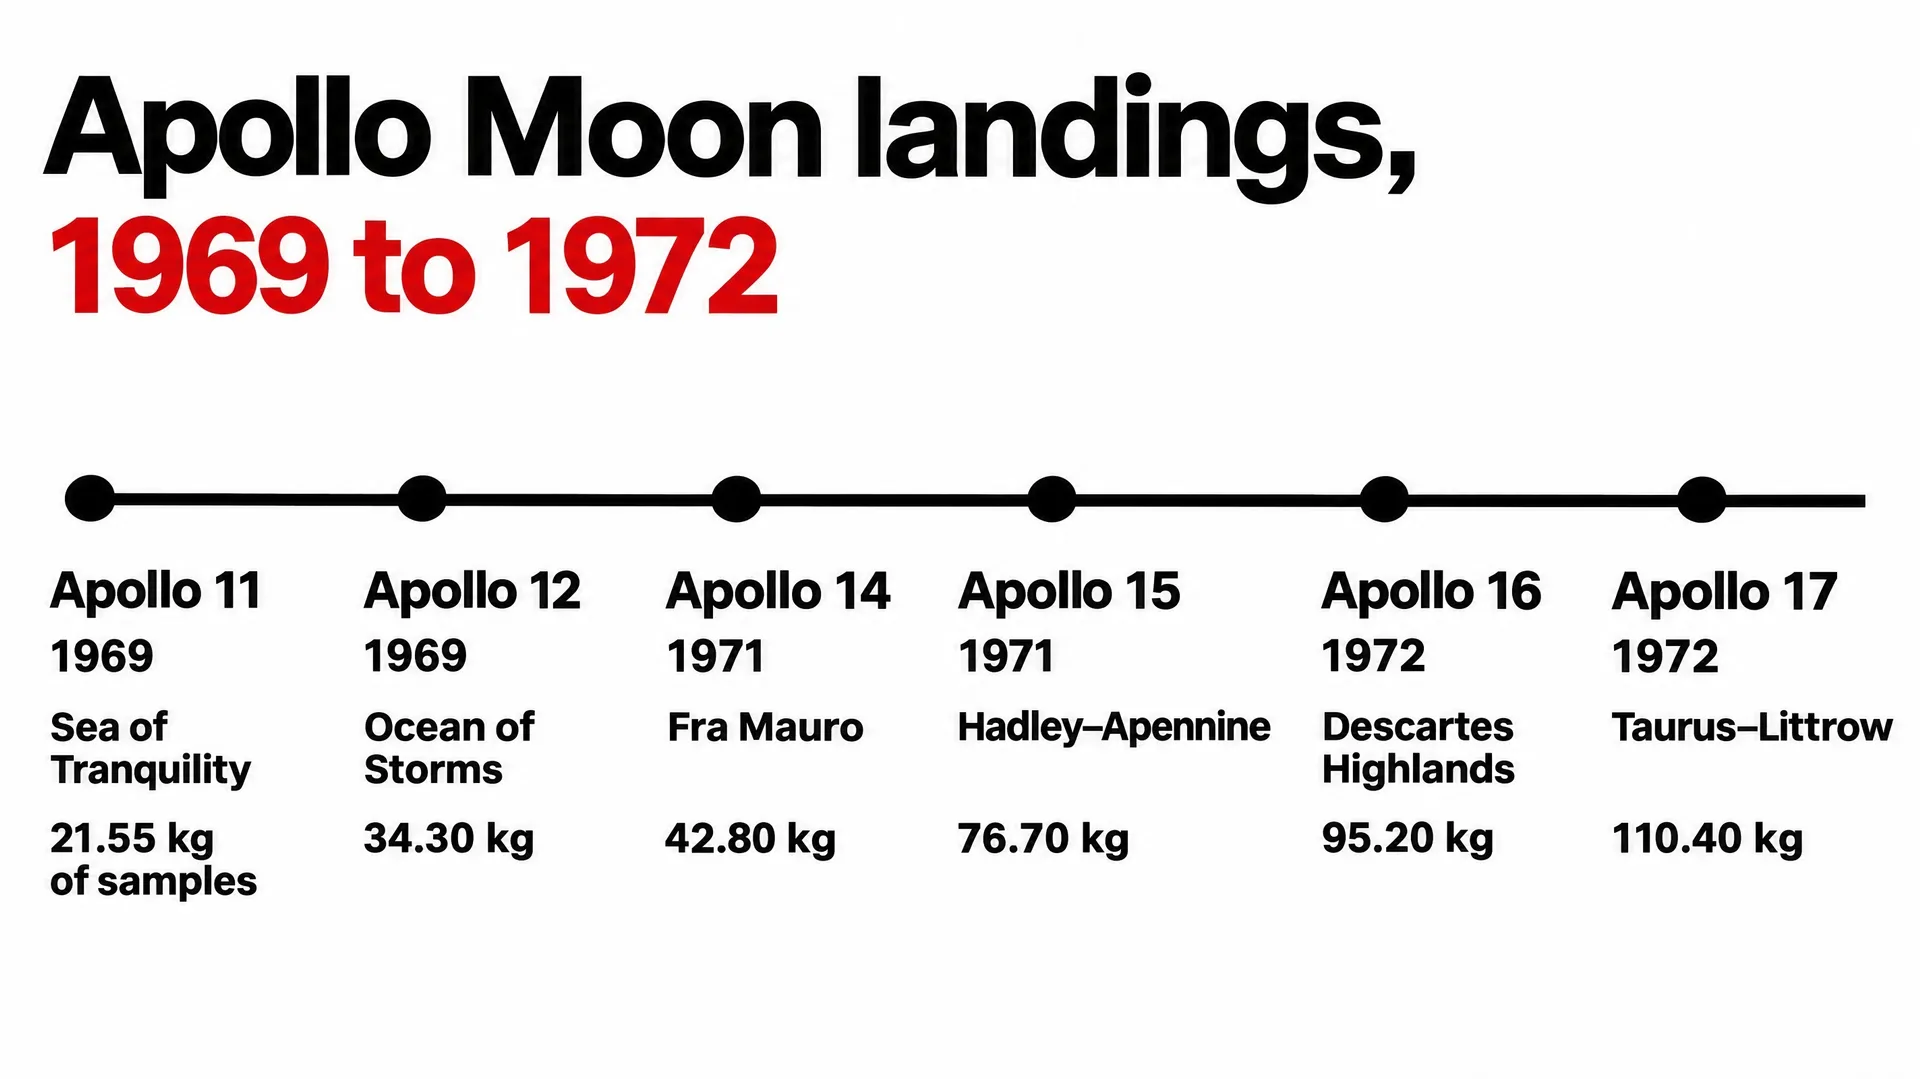
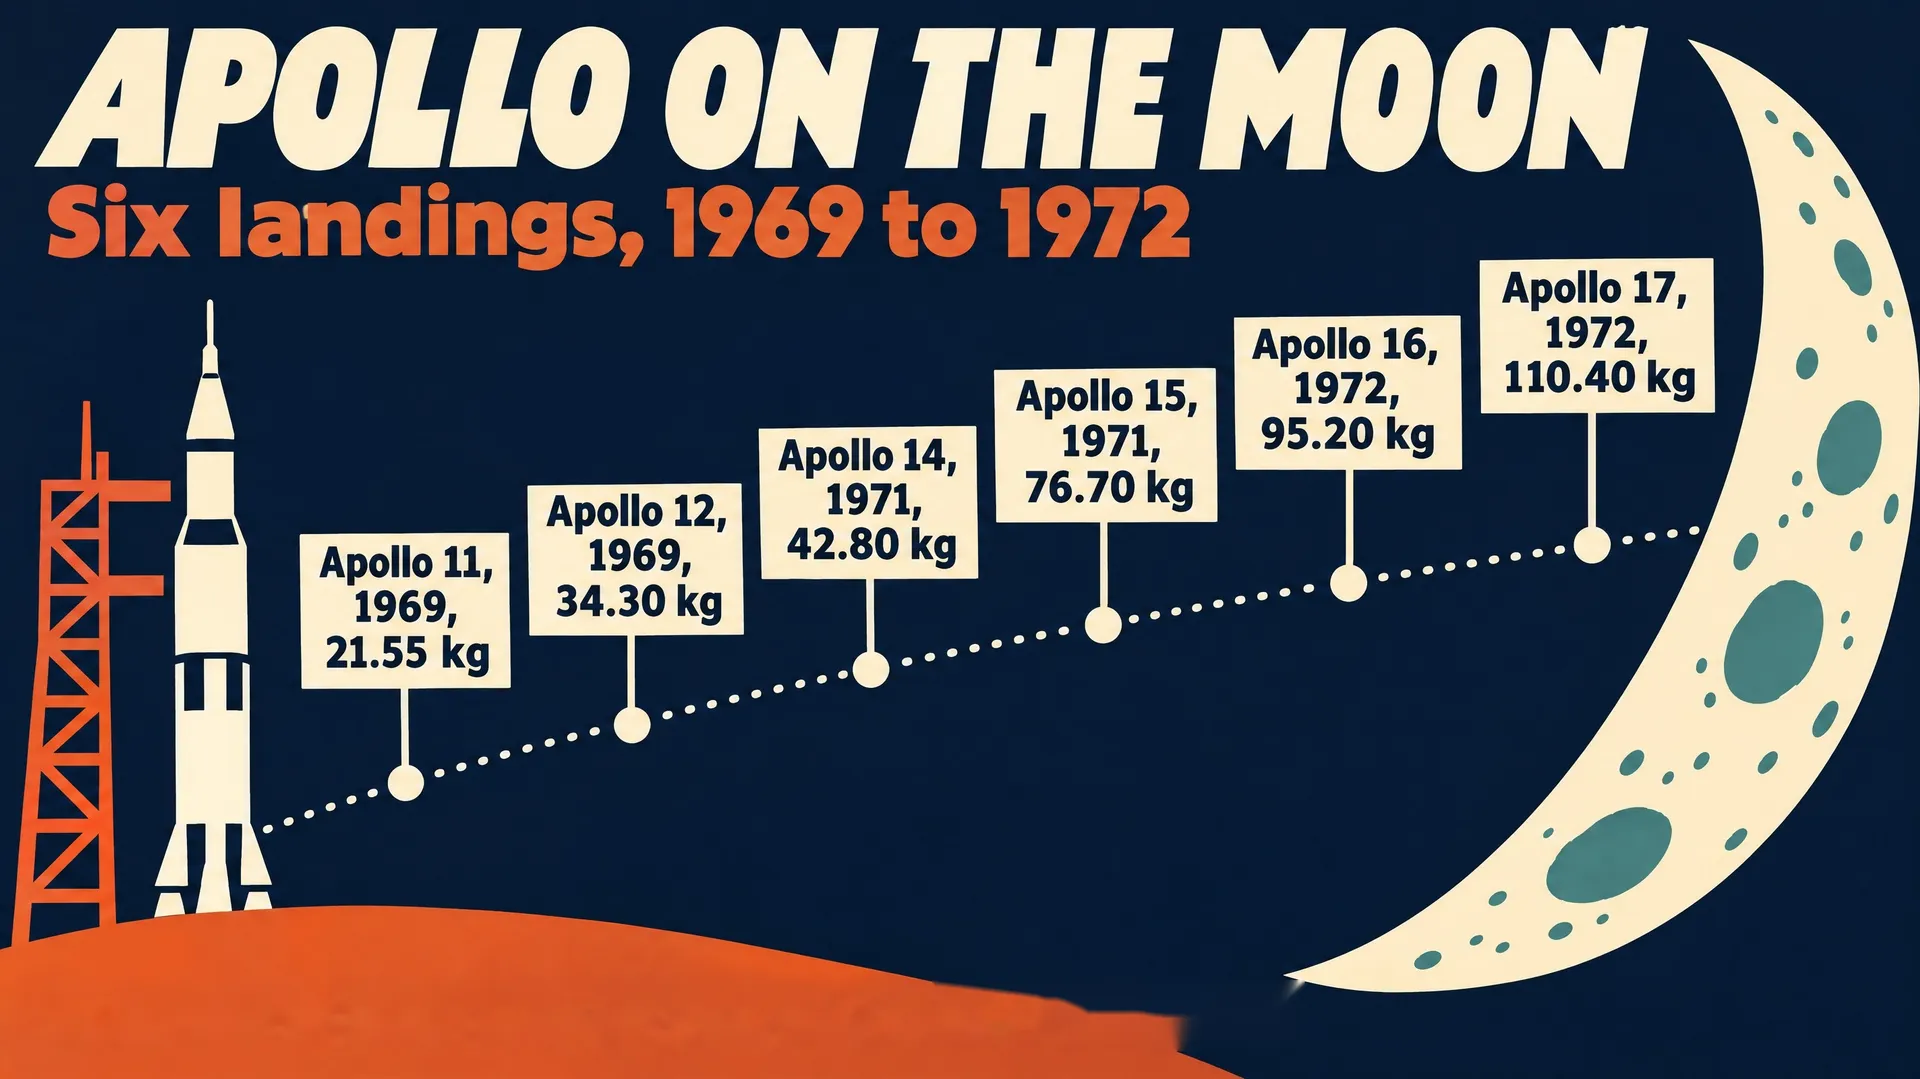
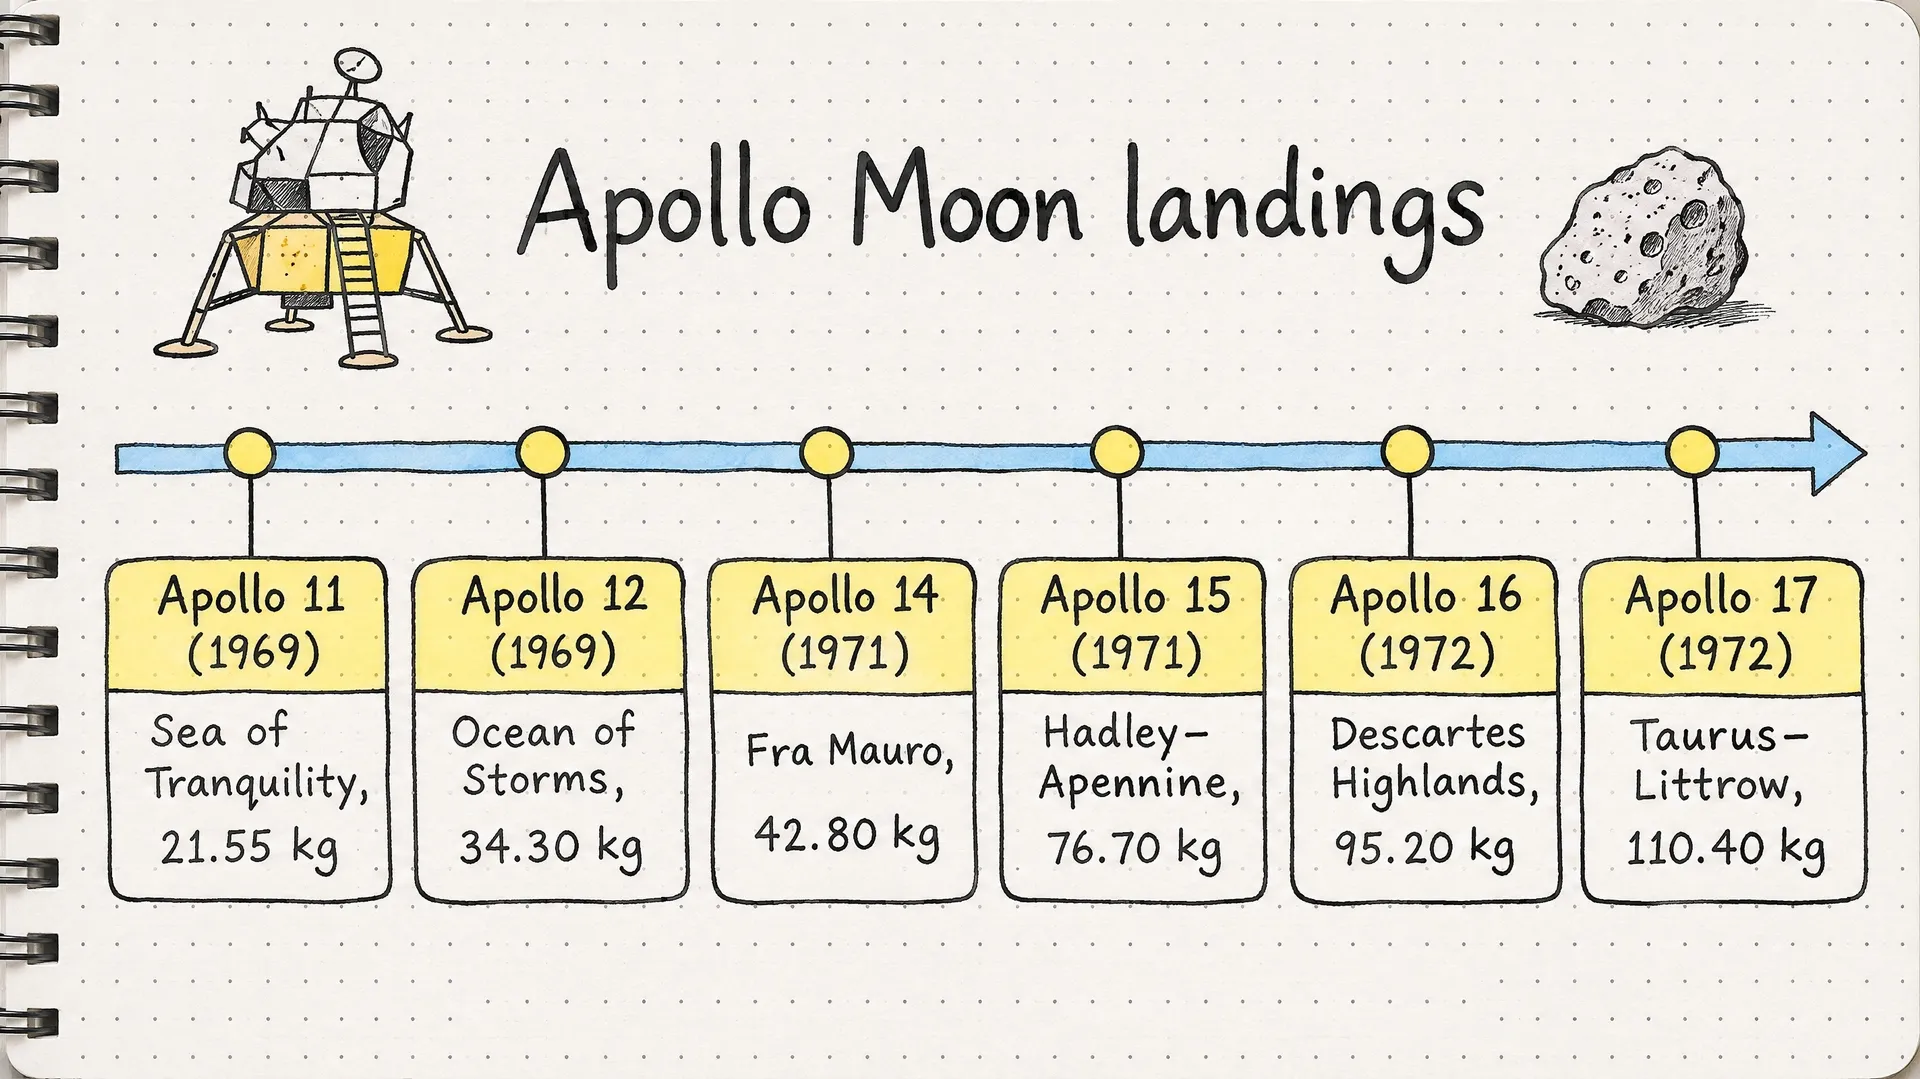
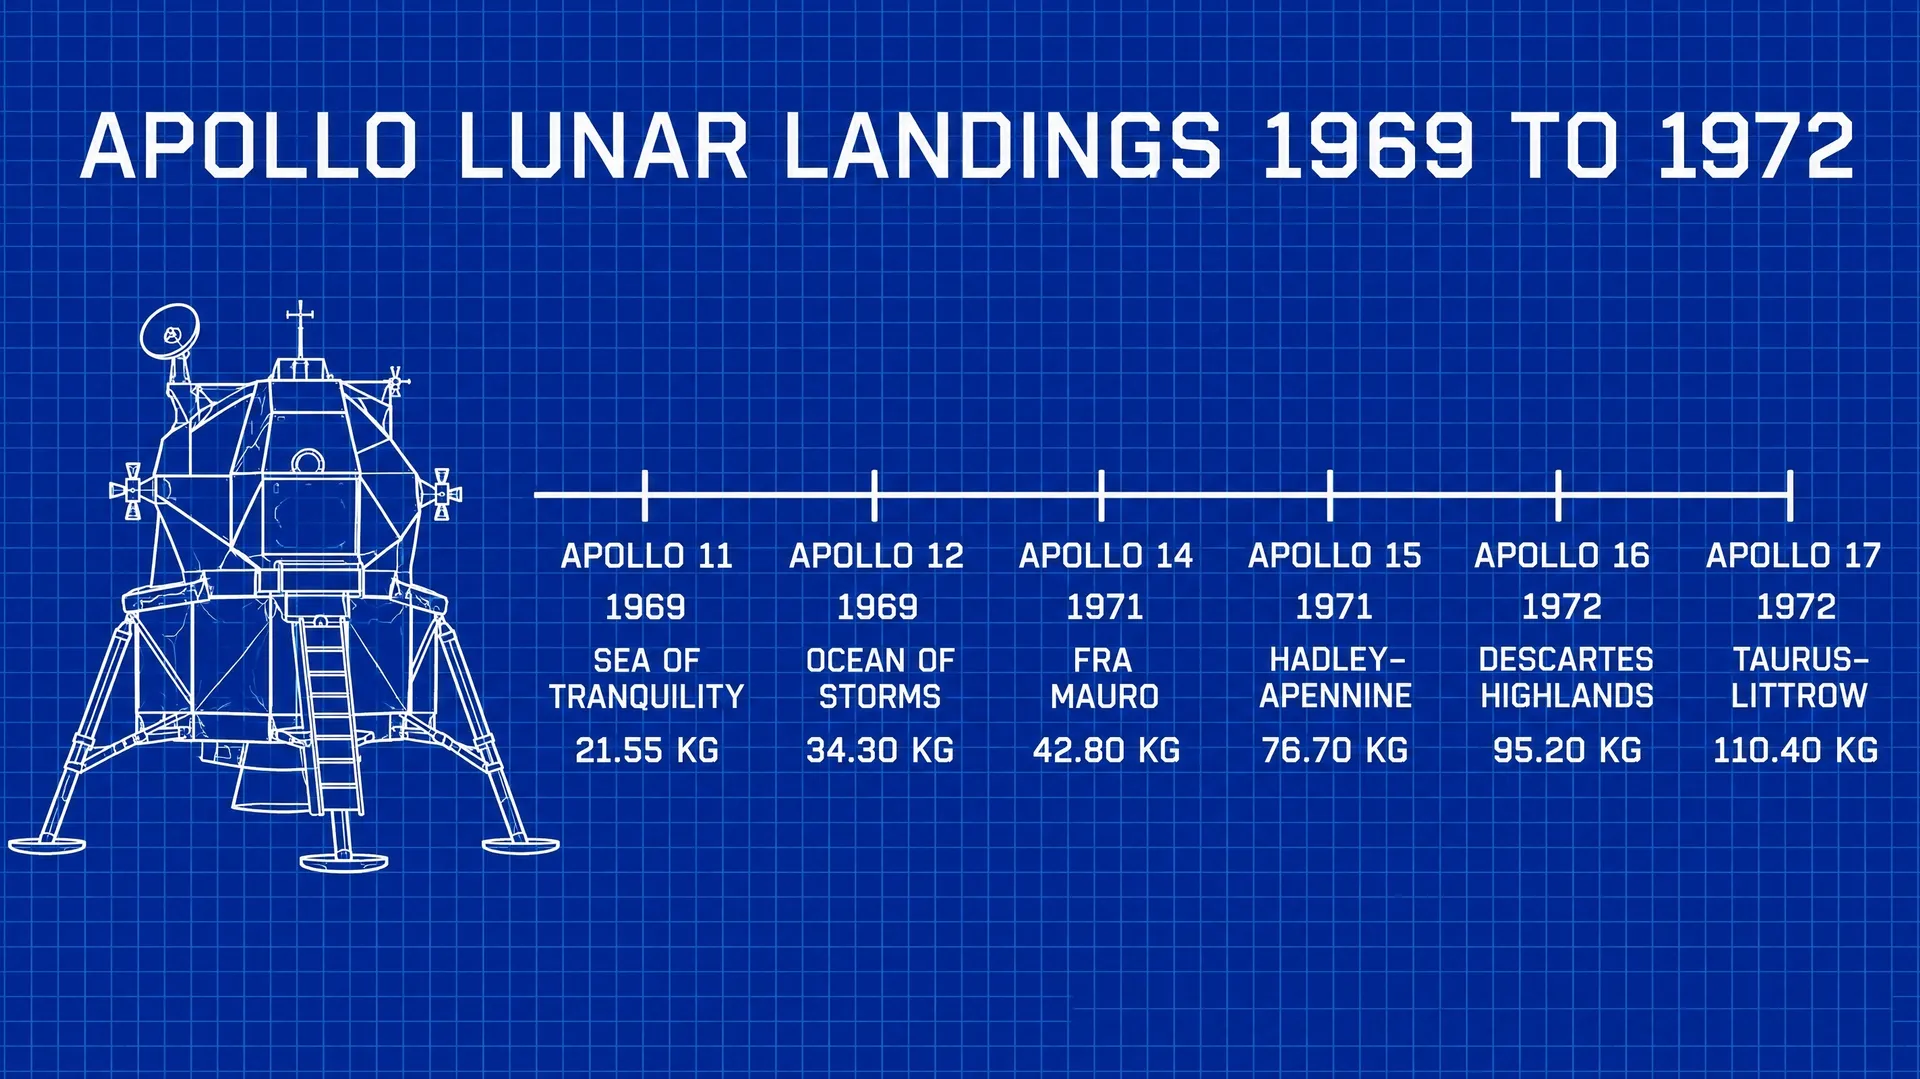
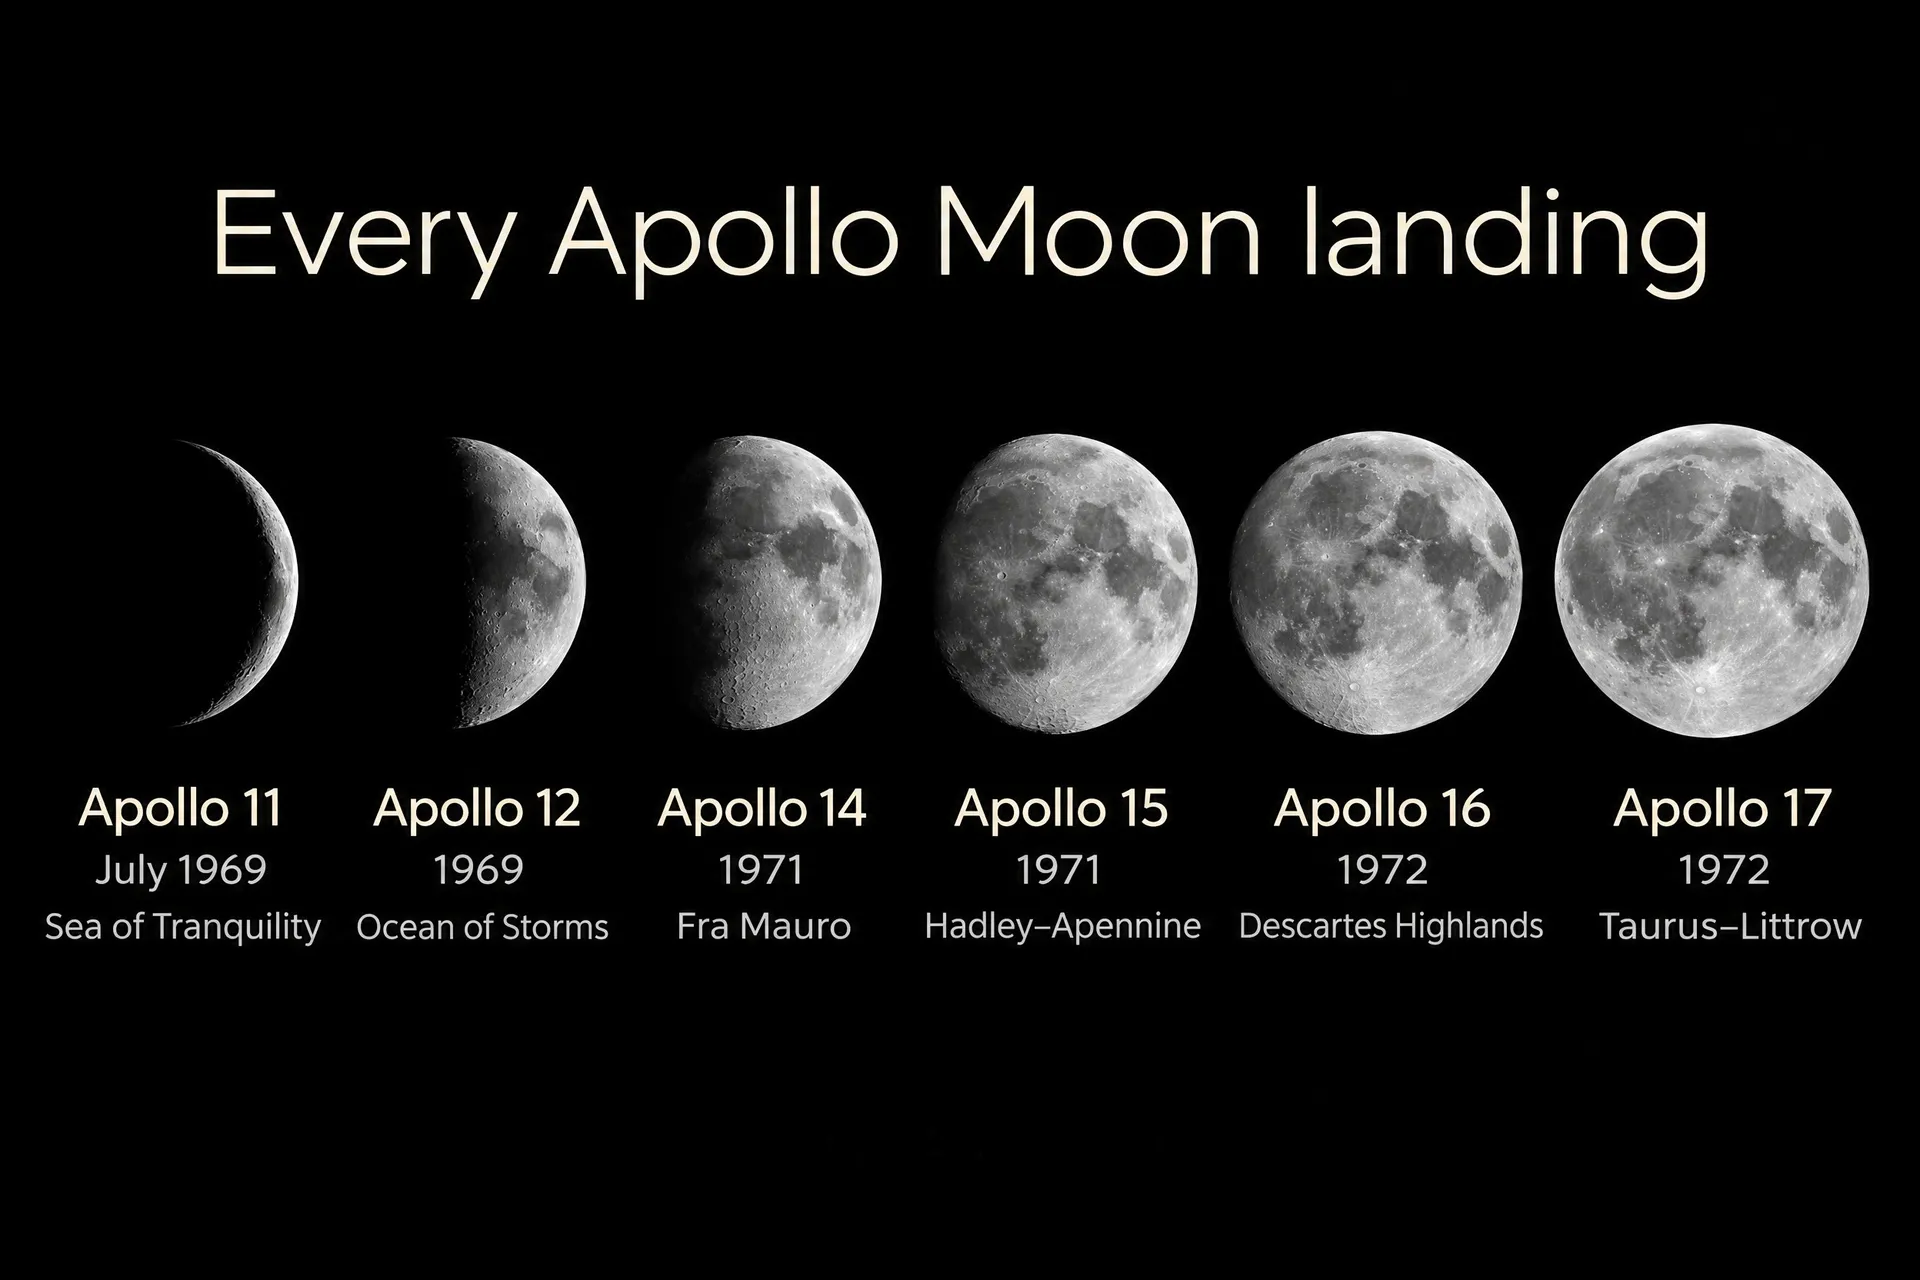
Each run gives a different layout. Keep the one where the title reads first and every number is easy to find. The same Apollo landing data came out as a Swiss grid, a space-age poster, a sketchnote and a blueprint from four prompts.
5. Check every number against your source
Read each figure, name and unit next to your source before you publish. Models set short text well but can still change a digit or a letter. Drawn shapes are a separate risk: bars, lines and icons are drawn, not calculated, so a bar may not match its value. If the shapes matter, check their proportions or choose a layout that shows the numbers as text, such as stat cards, a ranked list or a timeline.
5 types of AI infographics with examples
Each infographic below was made on getimg.ai from the prompt shown under it. Copy a prompt, swap in your own data and colors, and generate your version.
1. Statistical infographic
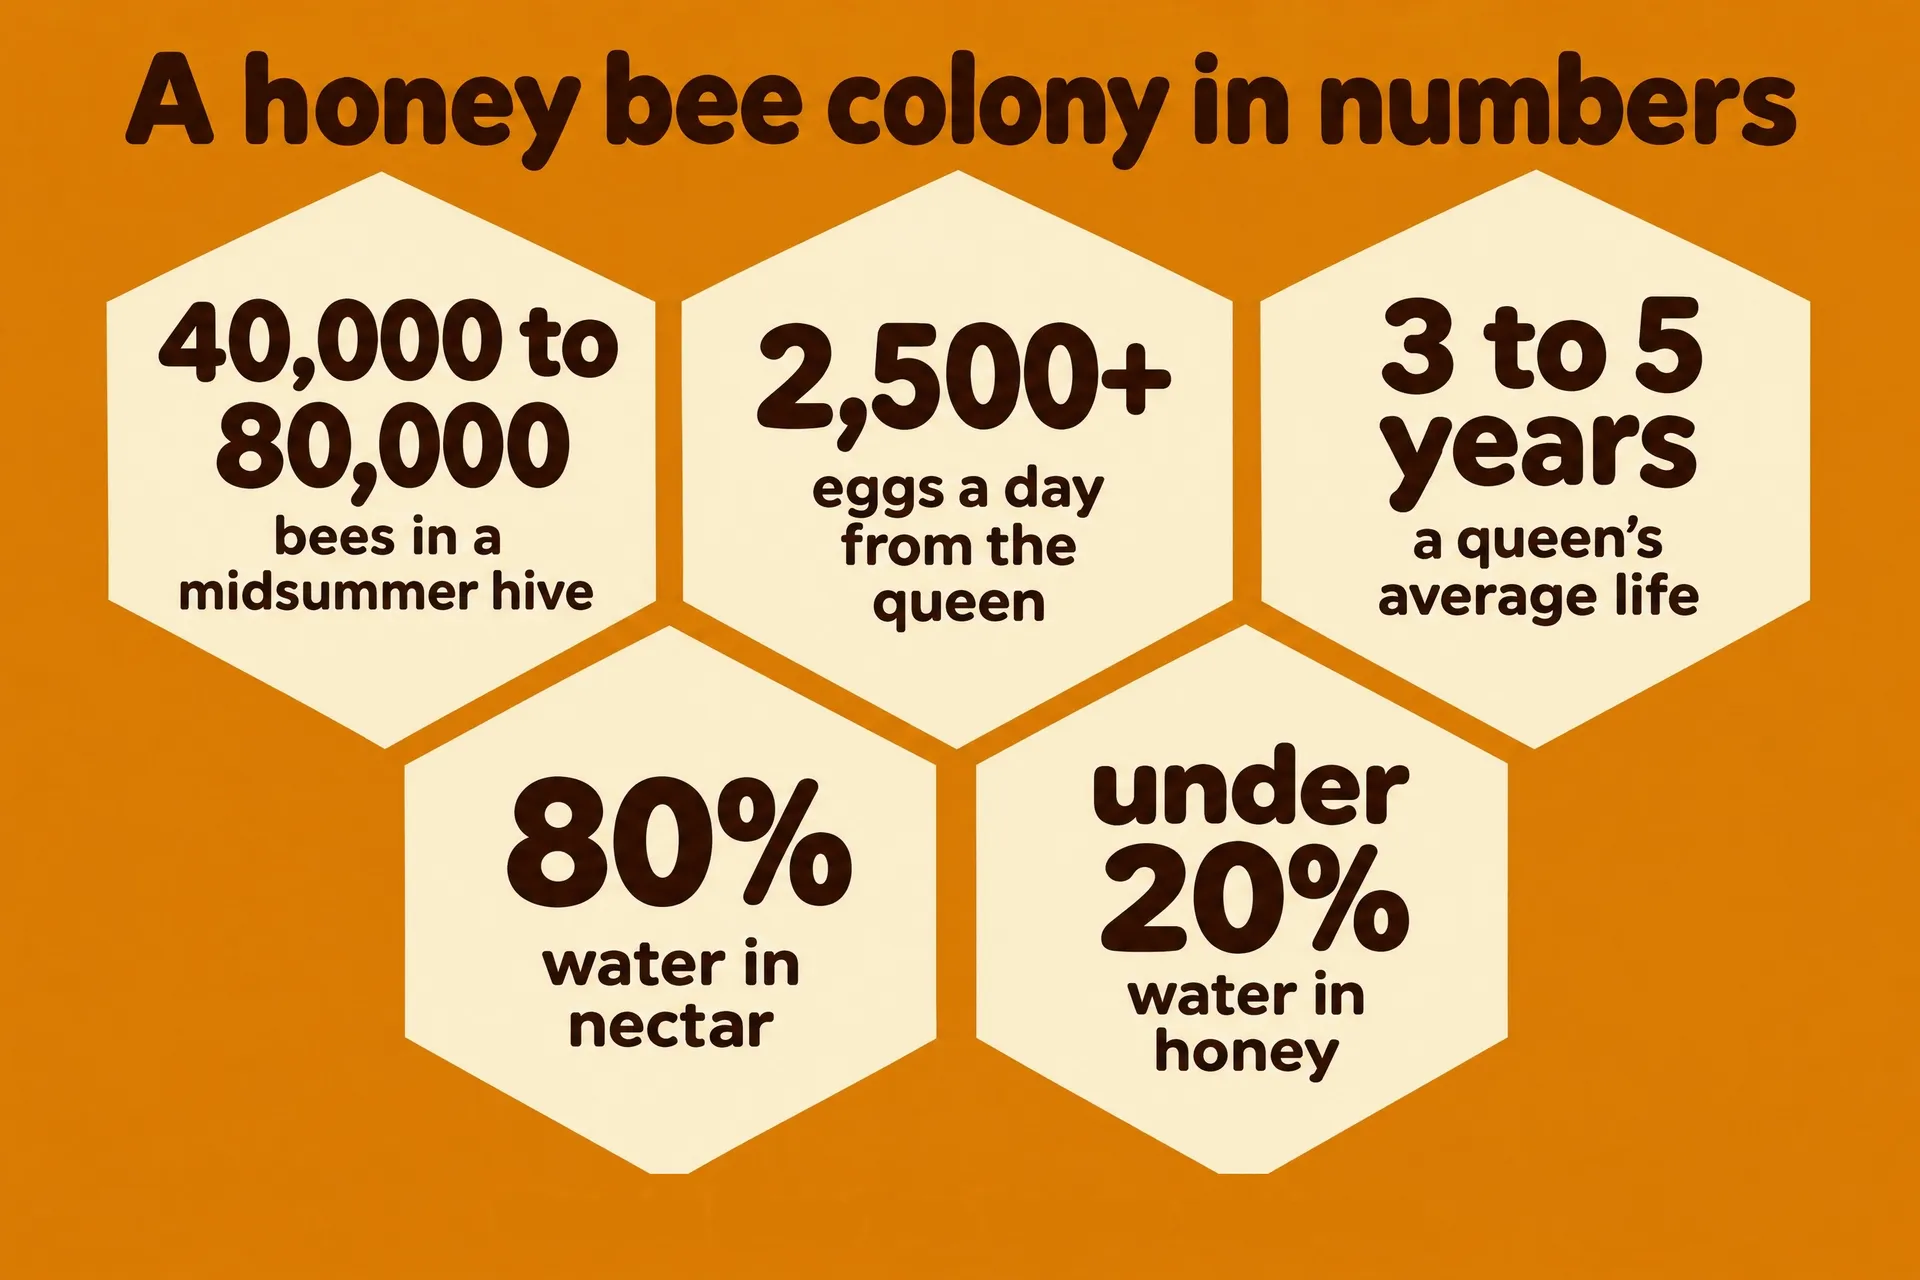
A statistical infographic puts a handful of standout numbers in front of the reader, each with a short line explaining it. It suits annual reports, product pages, fundraising and "by the numbers" social posts. The figures do the work, so give them the biggest type on the page.
The prompt:
Landscape statistical infographic on a deep honey amber background with cream and dark brown, a pattern of large flat cream hexagons, each hexagon holding one stat in a bold rounded sans with a short label: "40,000 to 80,000" "bees in a midsummer hive"; "2,500+" "eggs a day from the queen"; "3 to 5 years" "a queen's average life"; "80%" "water in nectar"; "under 20%" "water in honey". Title at top in dark brown: "A honey bee colony in numbers". No other text, no gradients, no 3D, no decorative dashes, sparkles or motion lines.
Tie the shape of the layout to the subject ("each stat in a hexagon" for bees). It makes the graphic recognizable before anyone reads a word.
2. Timeline infographic
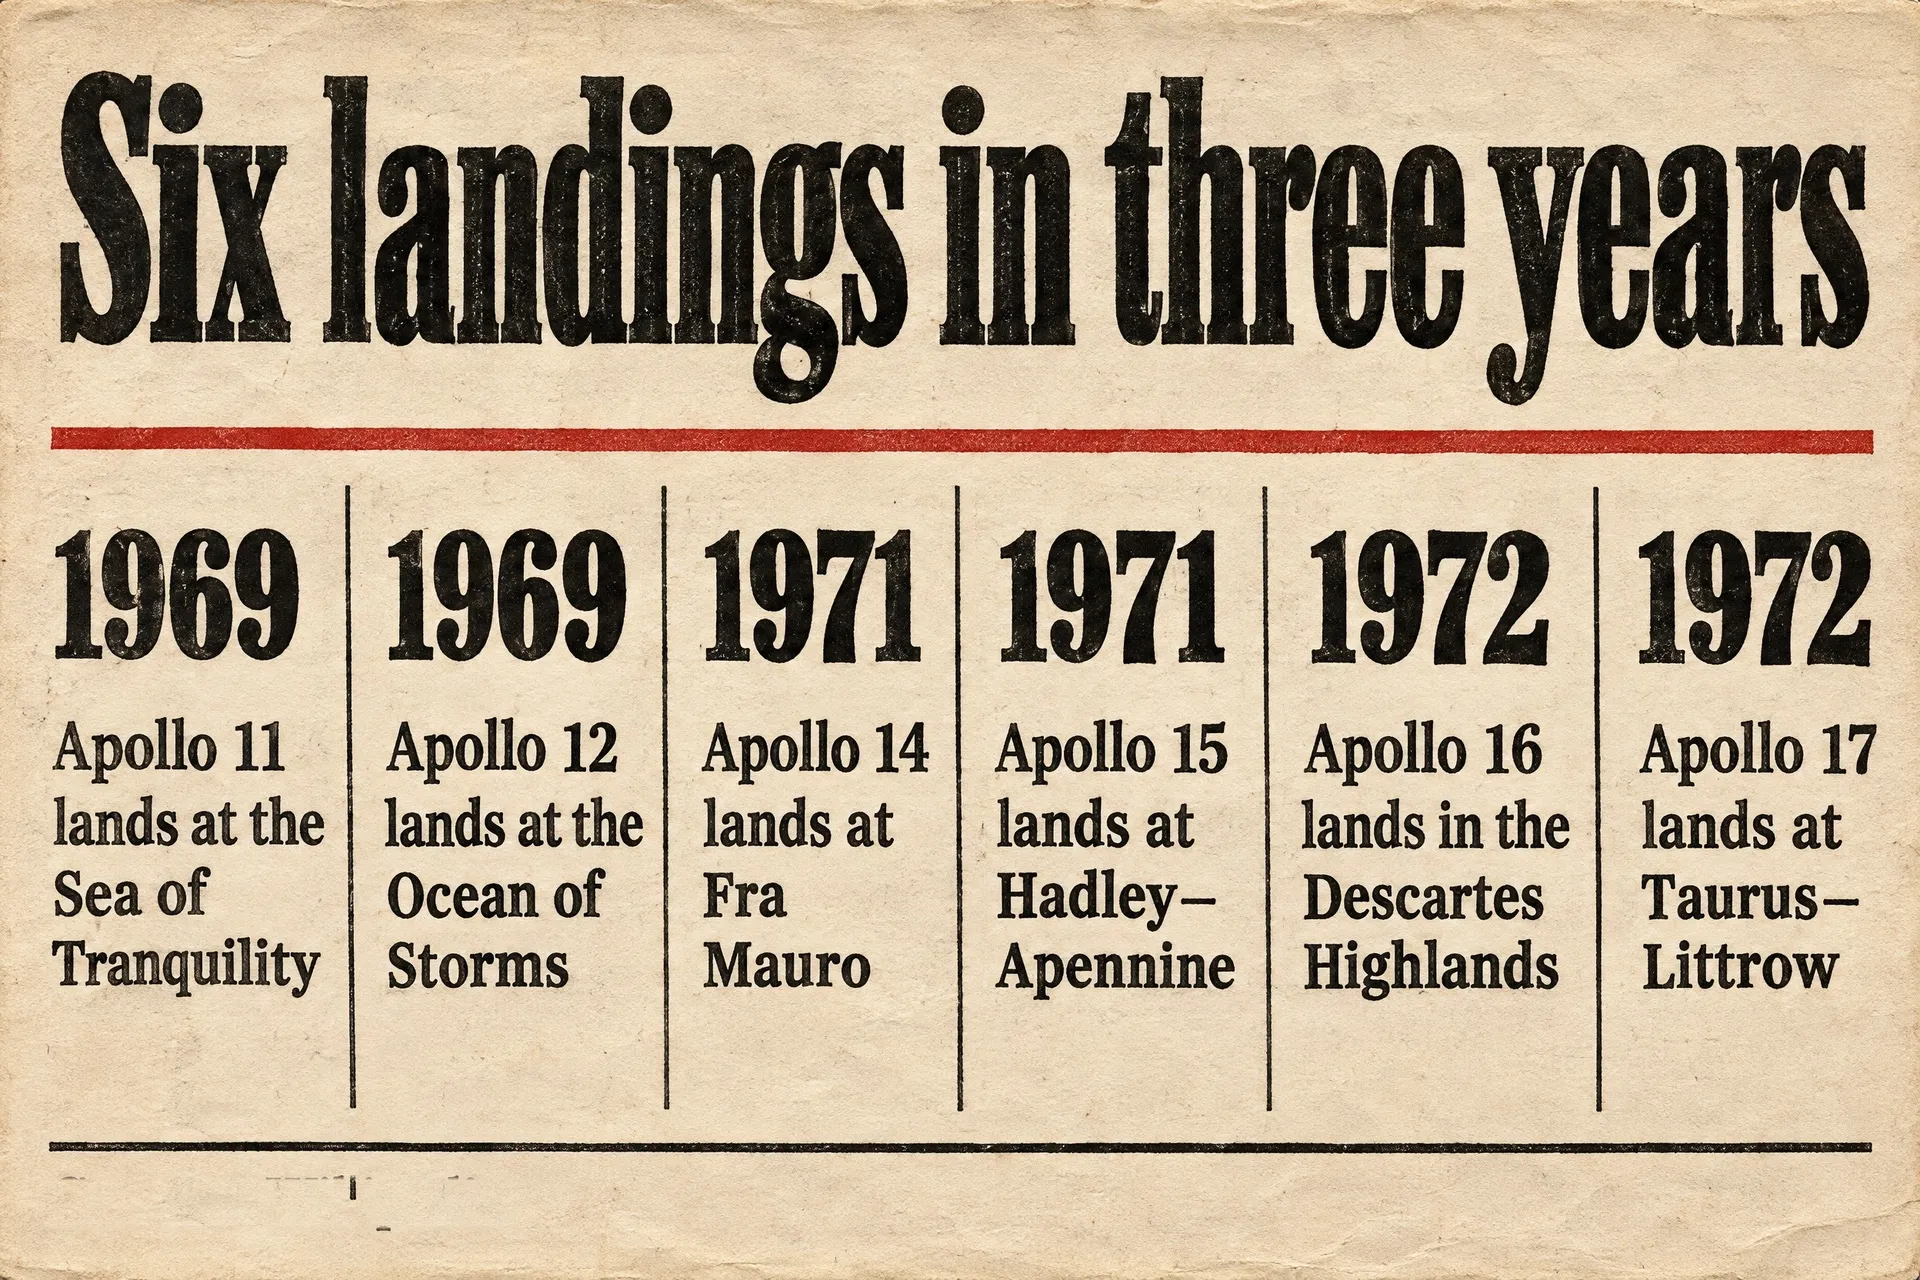
A timeline shows events in order, with dates as the main labels. It works for company histories, project milestones, product launches and history lessons. Keep each entry to a date and one short line, and space the entries evenly.
The prompt:
Landscape timeline infographic in a vintage mid-century newspaper style on off-white newsprint: black ink, one red accent, a vertical-rule column layout turned into a horizontal timeline with six dated entries, each with a bold year and a short line: "1969" "Apollo 11 lands at the Sea of Tranquility", "1969" "Apollo 12 lands at the Ocean of Storms", "1971" "Apollo 14 lands at Fra Mauro", "1971" "Apollo 15 lands at Hadley–Apennine", "1972" "Apollo 16 lands in the Descartes Highlands", "1972" "Apollo 17 lands at Taurus–Littrow". Headline in a heavy condensed serif: "Six landings in three years". No photos, no other text, no gradients, no decorative dashes, sparkles or motion lines.
Write the headline as the takeaway ("Six landings in three years") rather than the topic. It tells readers what to notice in the dates.
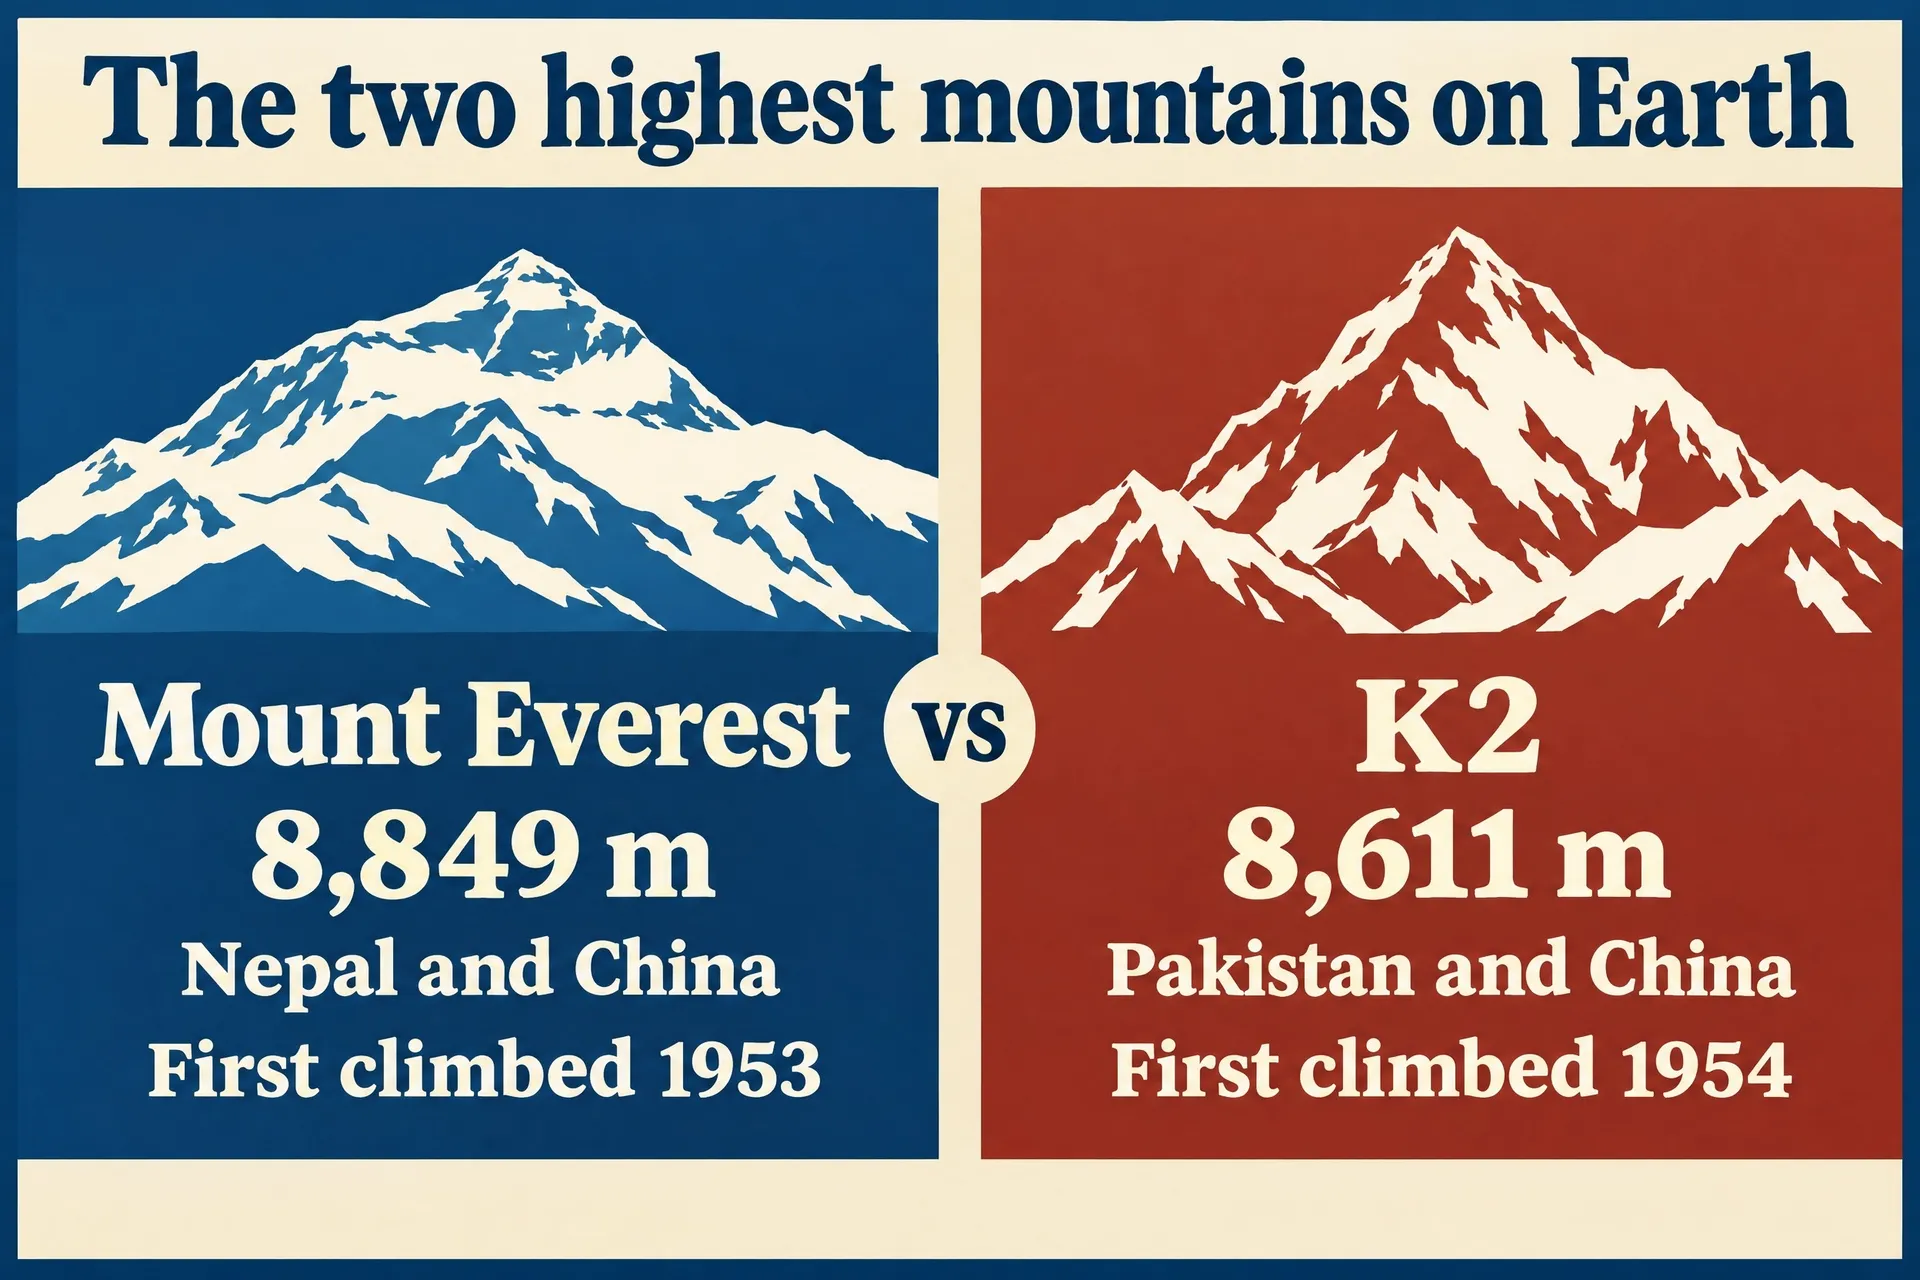
3. Comparison infographic
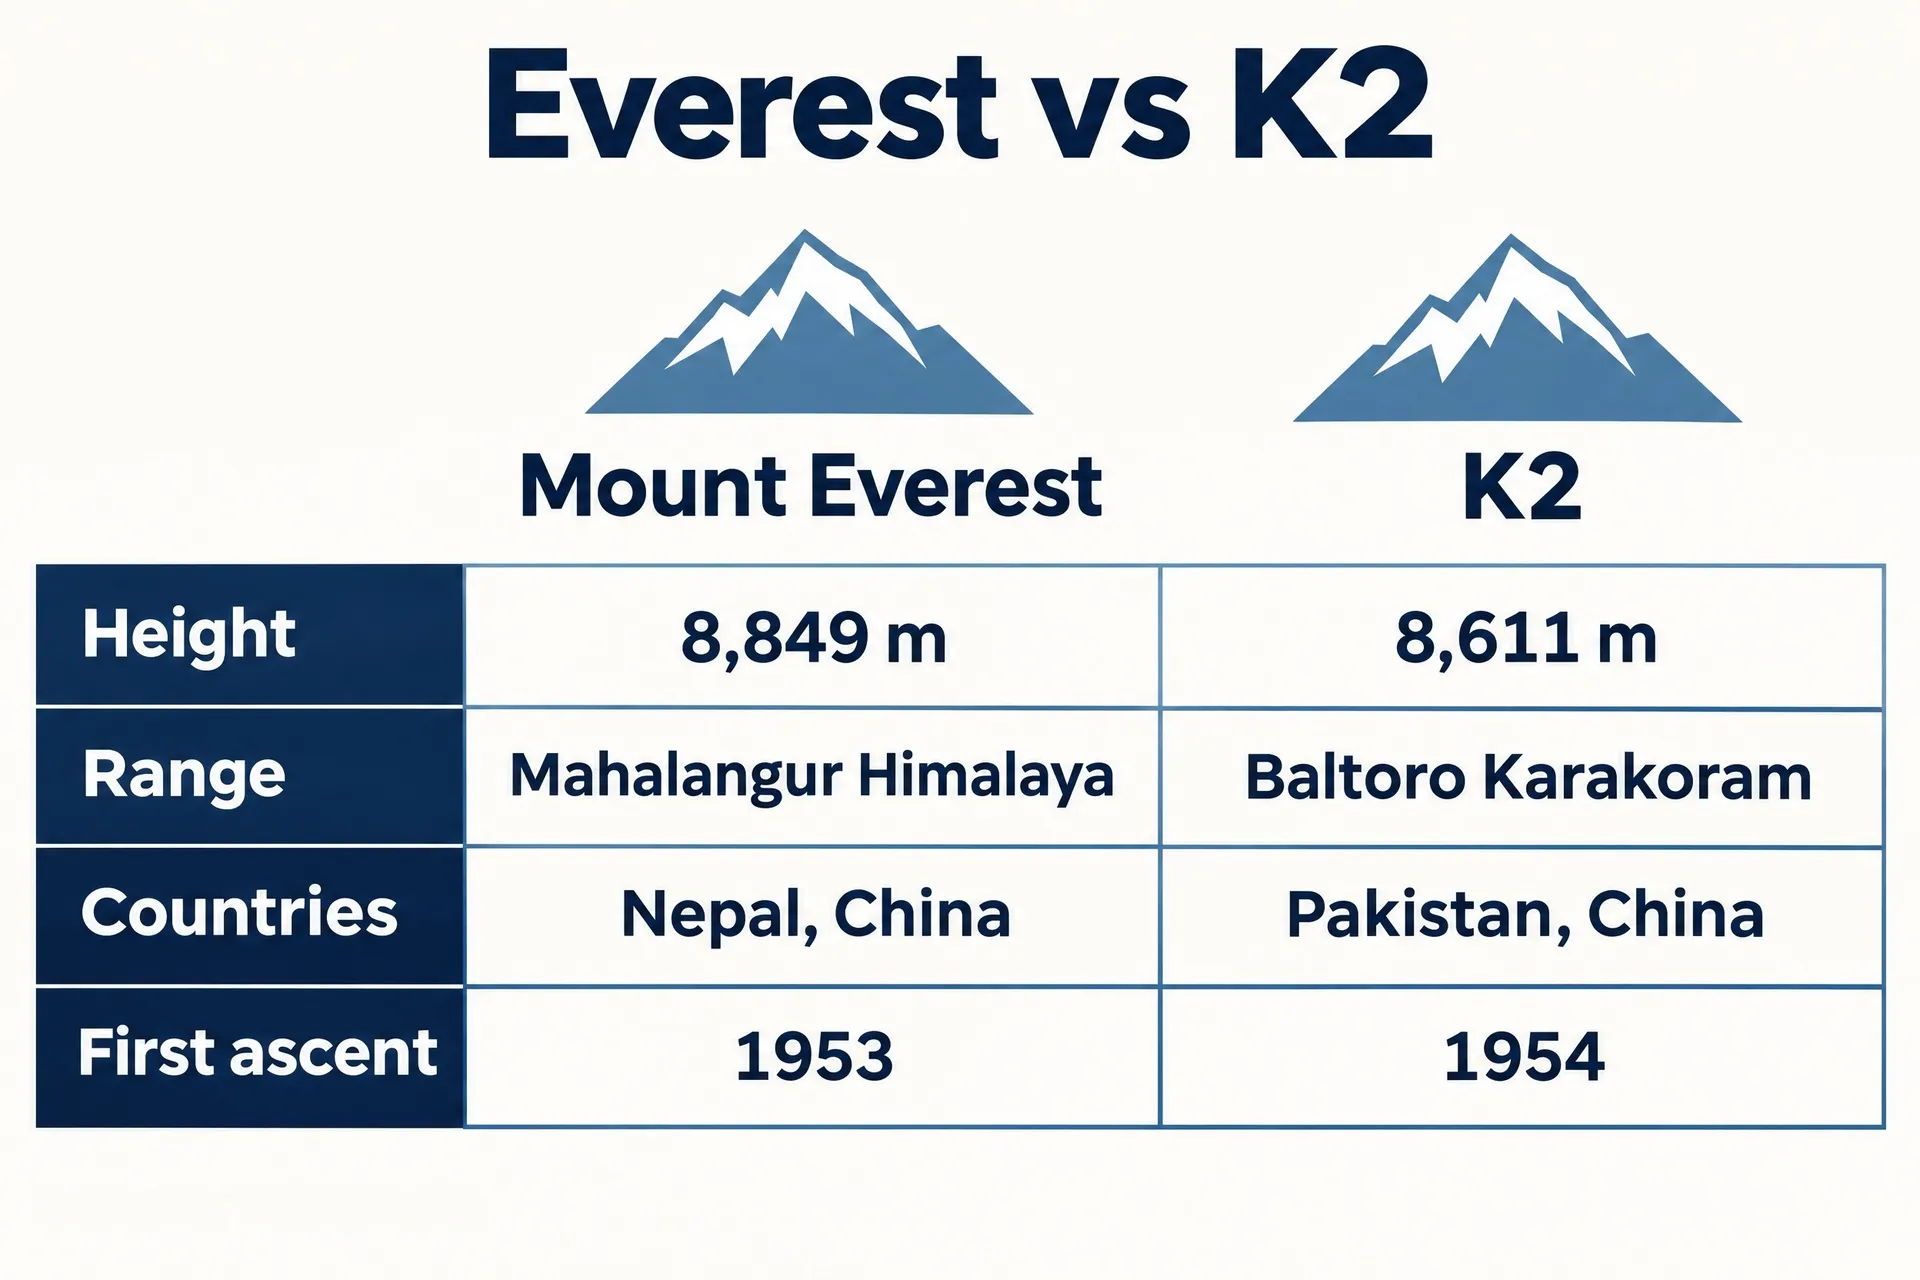
A comparison puts two things side by side on the same measures: two products, two plans, before and after. Use the same rows for both sides so readers can scan across. Two items is ideal. Three still works in a table.
The prompt:
Landscape comparison infographic, two columns side by side in a vintage mountaineering poster style: left half deep blue with a flat illustration of Mount Everest, right half rust red with a flat illustration of K2, a cream band in the middle with "vs". Left column text: "Mount Everest" "8,849 m" "Nepal and China" "First climbed 1953". Right column: "K2" "8,611 m" "Pakistan and China" "First climbed 1954". Title across the top: "The two highest mountains on Earth". No other text, no gradients, no 3D, no decorative dashes, sparkles or motion lines.
Give each side its own color and keep everything else identical. The color tells readers which column they're in.
4. Process infographic
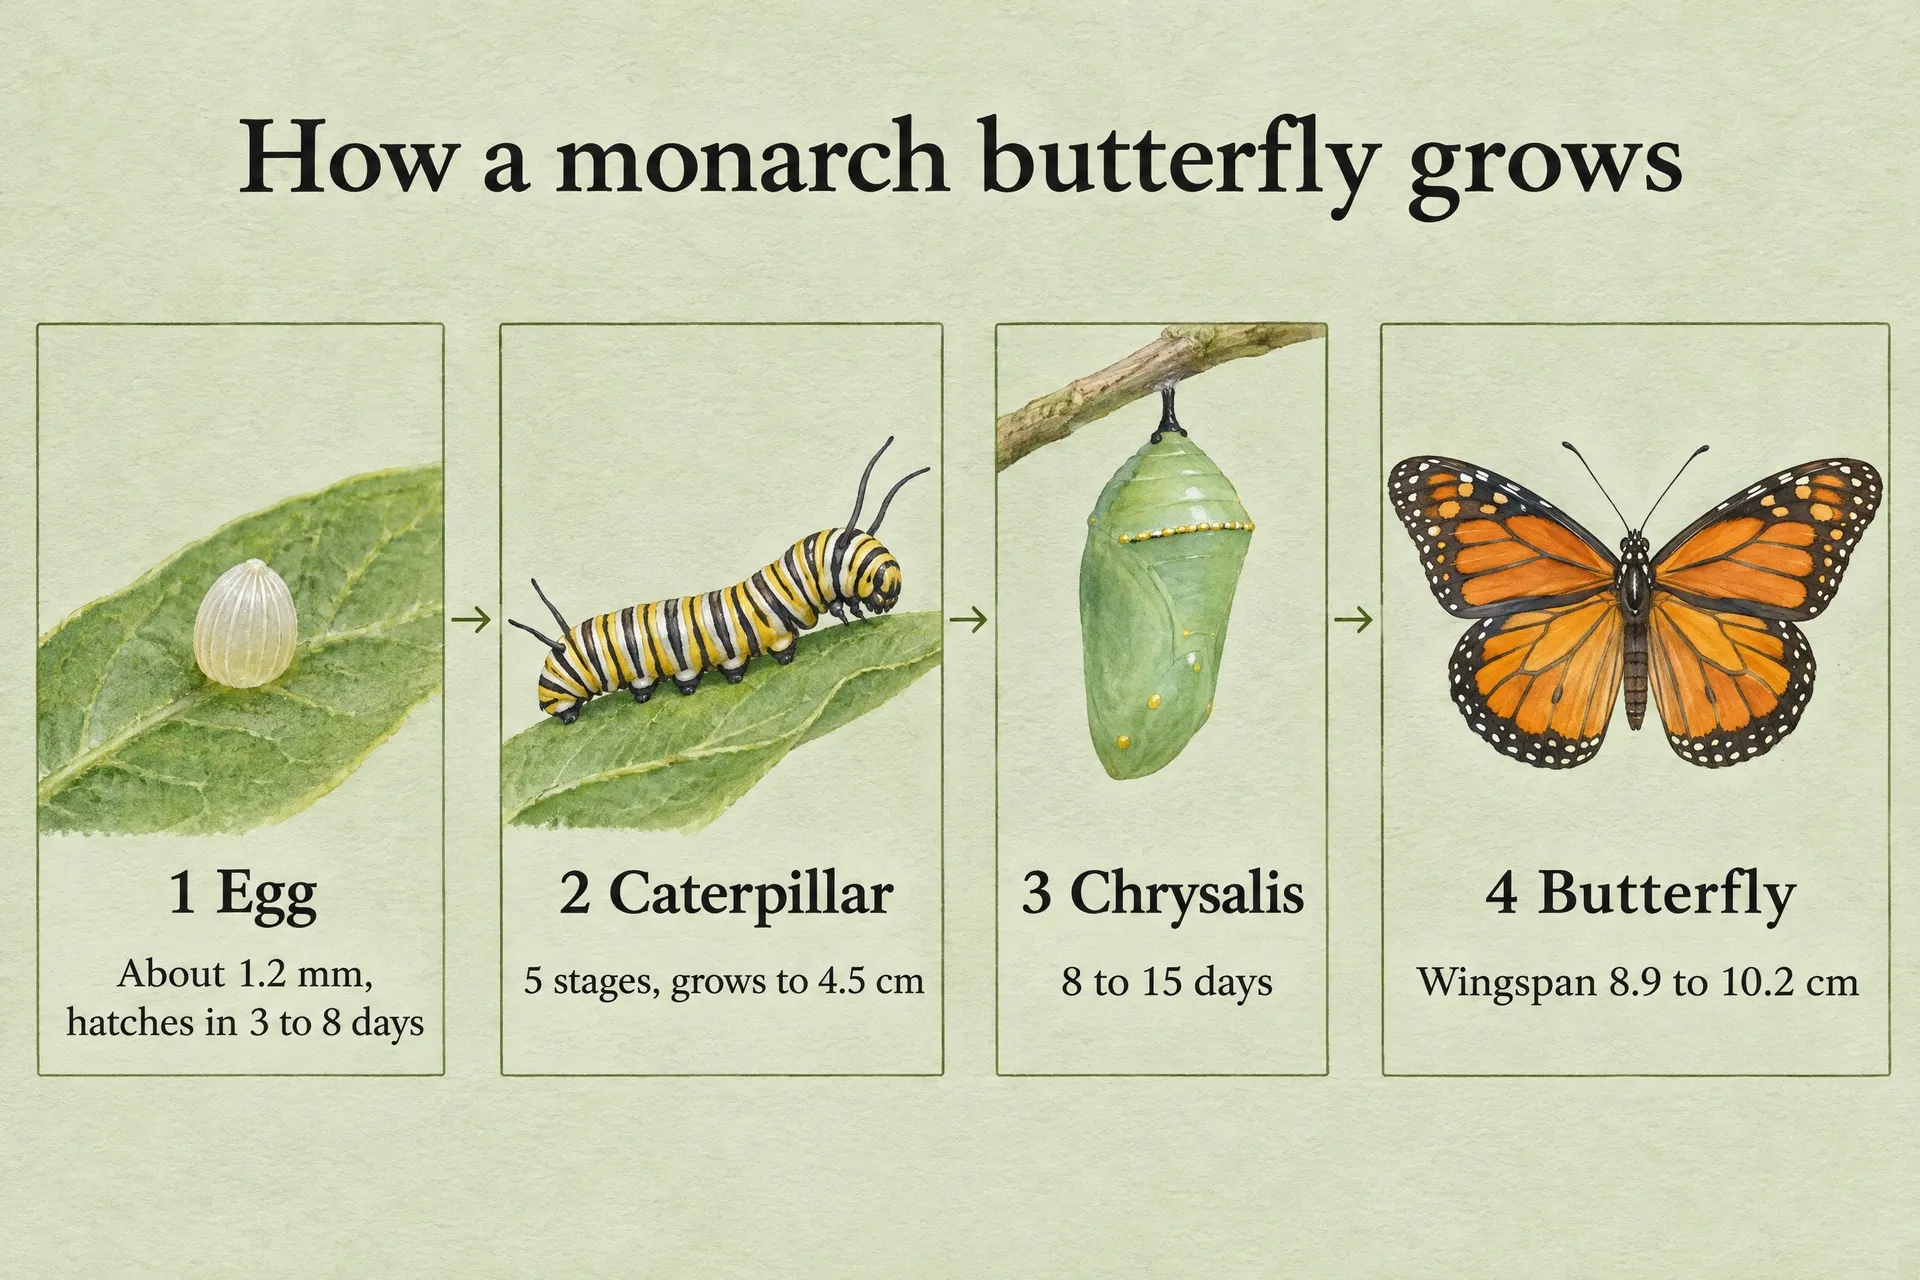
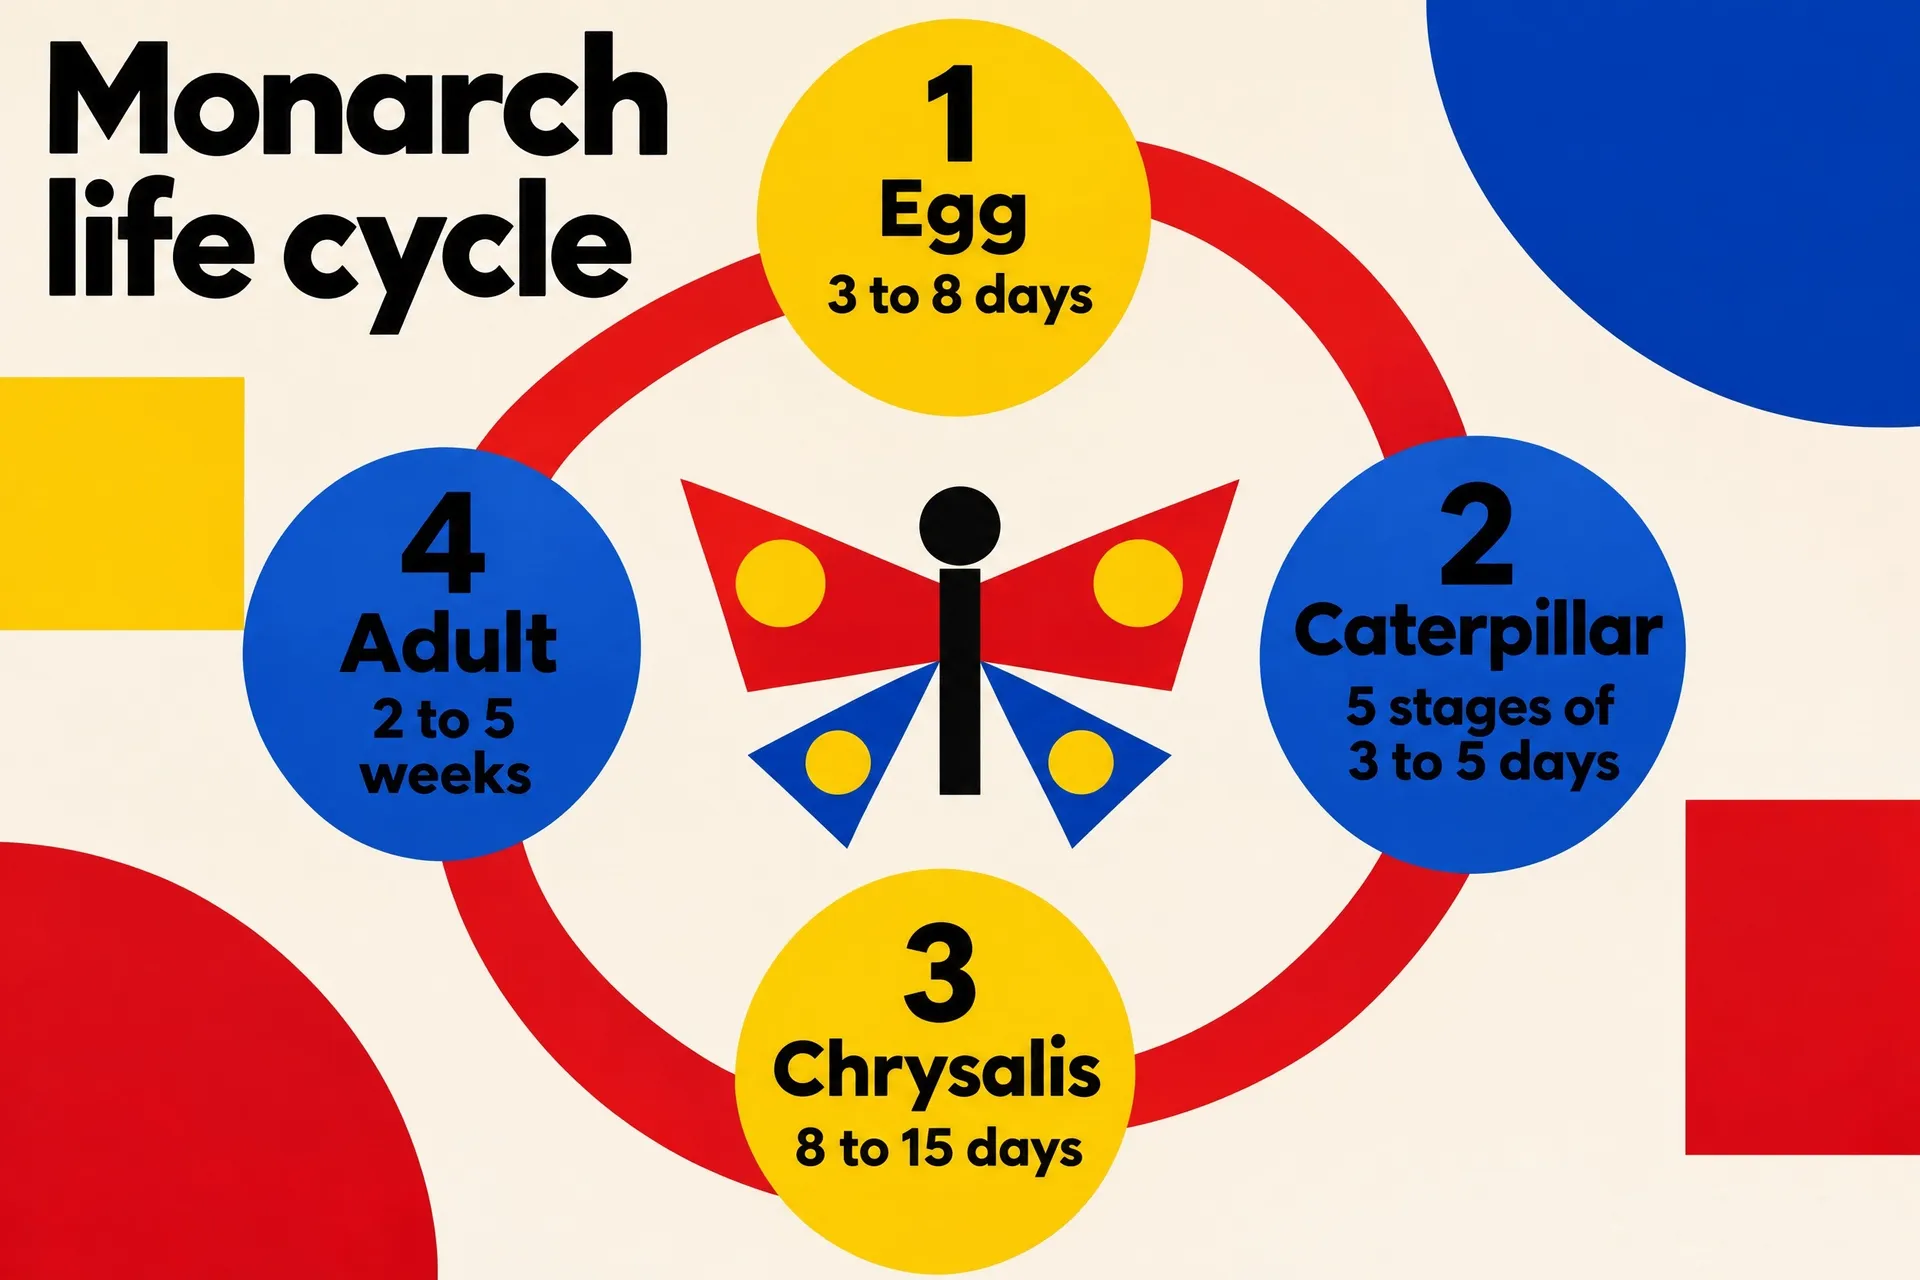
A process infographic walks through steps or stages in order: how a product is made, how to sign up, how a plant grows. Number the steps, give each one an image and a short caption, and connect them with arrows.
The prompt:
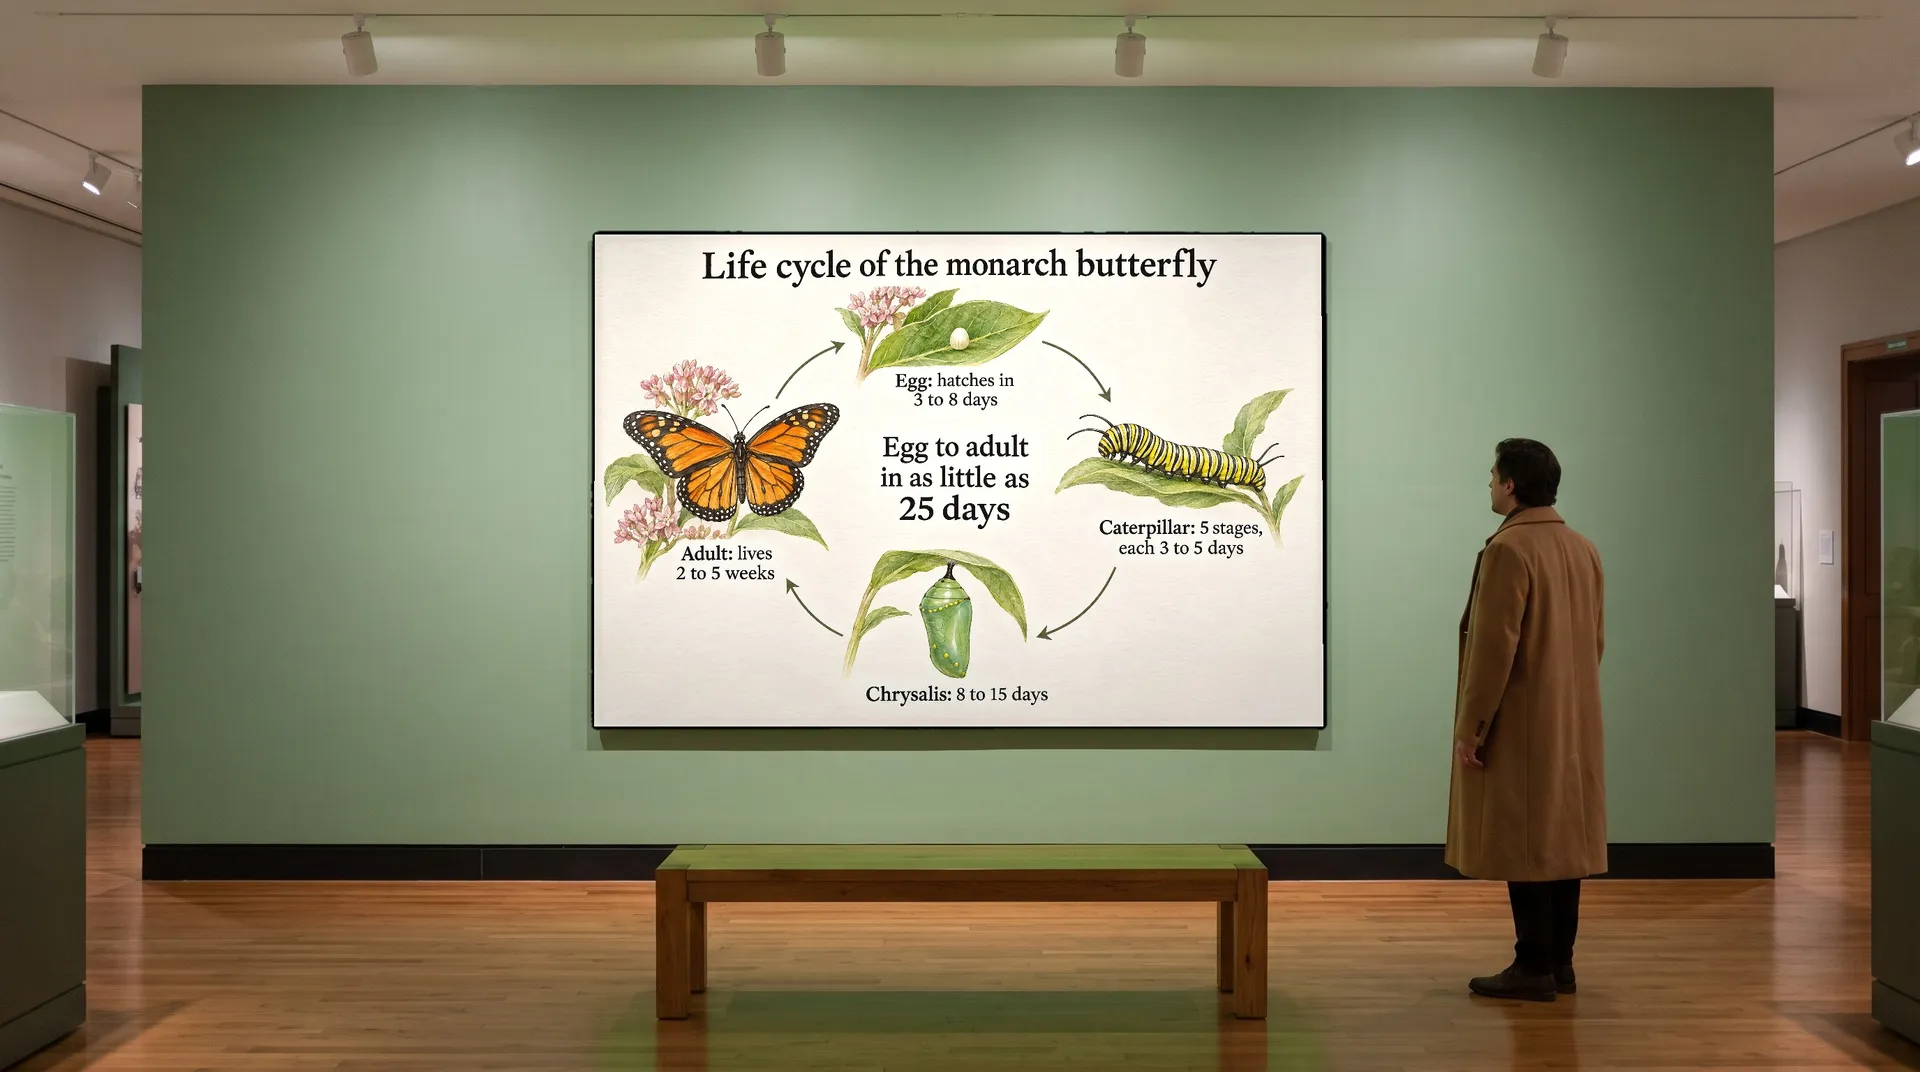
Landscape process infographic in a scientific field guide style: four numbered panels in a row on pale sage paper, each with a precise watercolor illustration and a caption in a classic serif: "1 Egg" "About 1.2 mm, hatches in 3 to 8 days"; "2 Caterpillar" "5 stages, grows to 4.5 cm"; "3 Chrysalis" "8 to 15 days"; "4 Butterfly" "Wingspan 8.9 to 10.2 cm". Thin arrows between panels. Title: "How a monarch butterfly grows". No other text, no gradients, no 3D, no decorative dashes, sparkles or motion lines.
Describe what each panel should show ("a cream egg on a milkweed leaf"). Specific images make the steps easier to follow than icons alone.
5. Ranking infographic
A ranking lists items from first to last on one measure: top sellers, biggest markets, longest rivers. Put the rank, the name and the figure on one line each, with the figure aligned so the numbers are easy to compare.
The prompt:
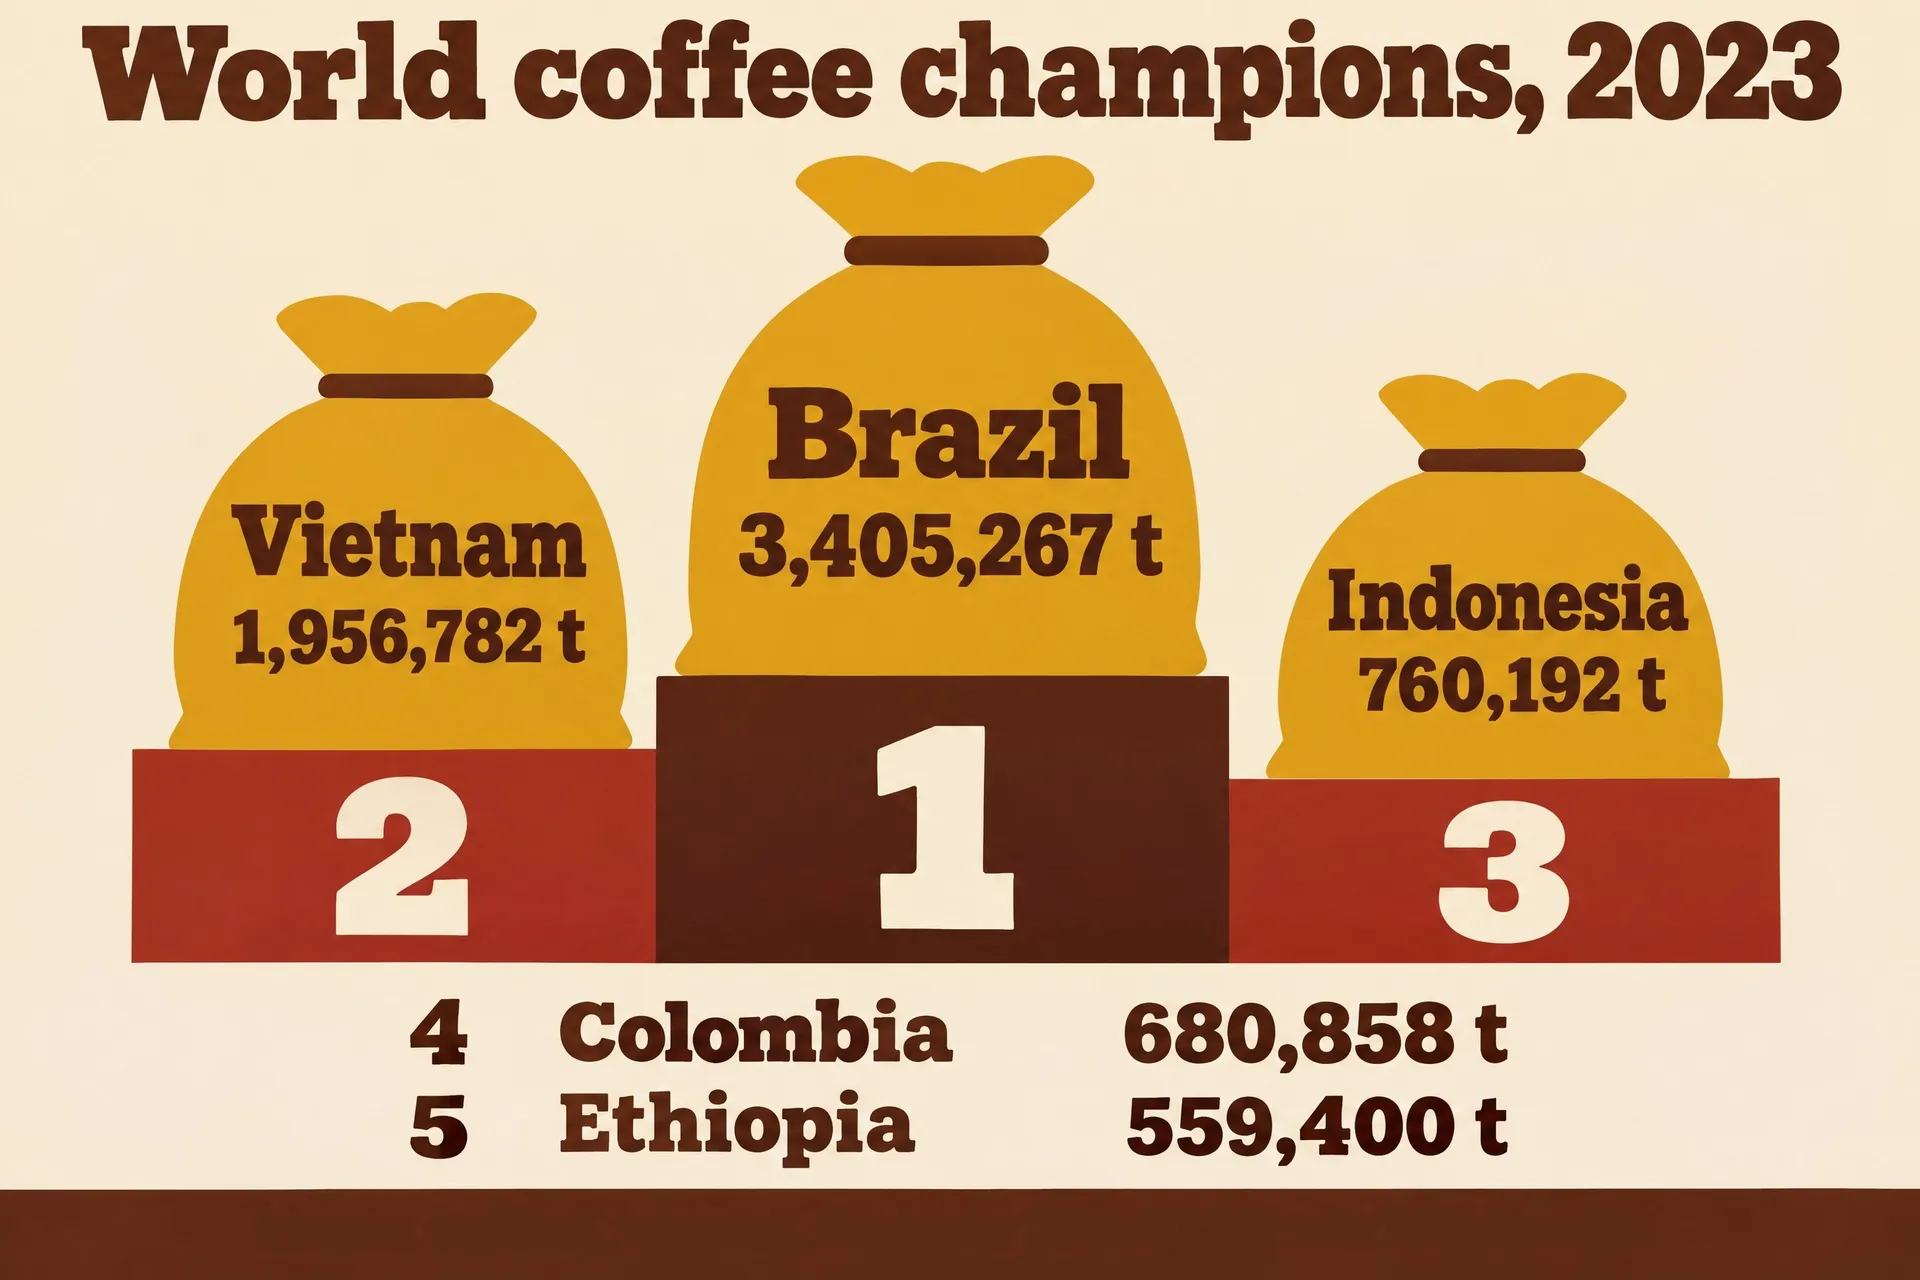
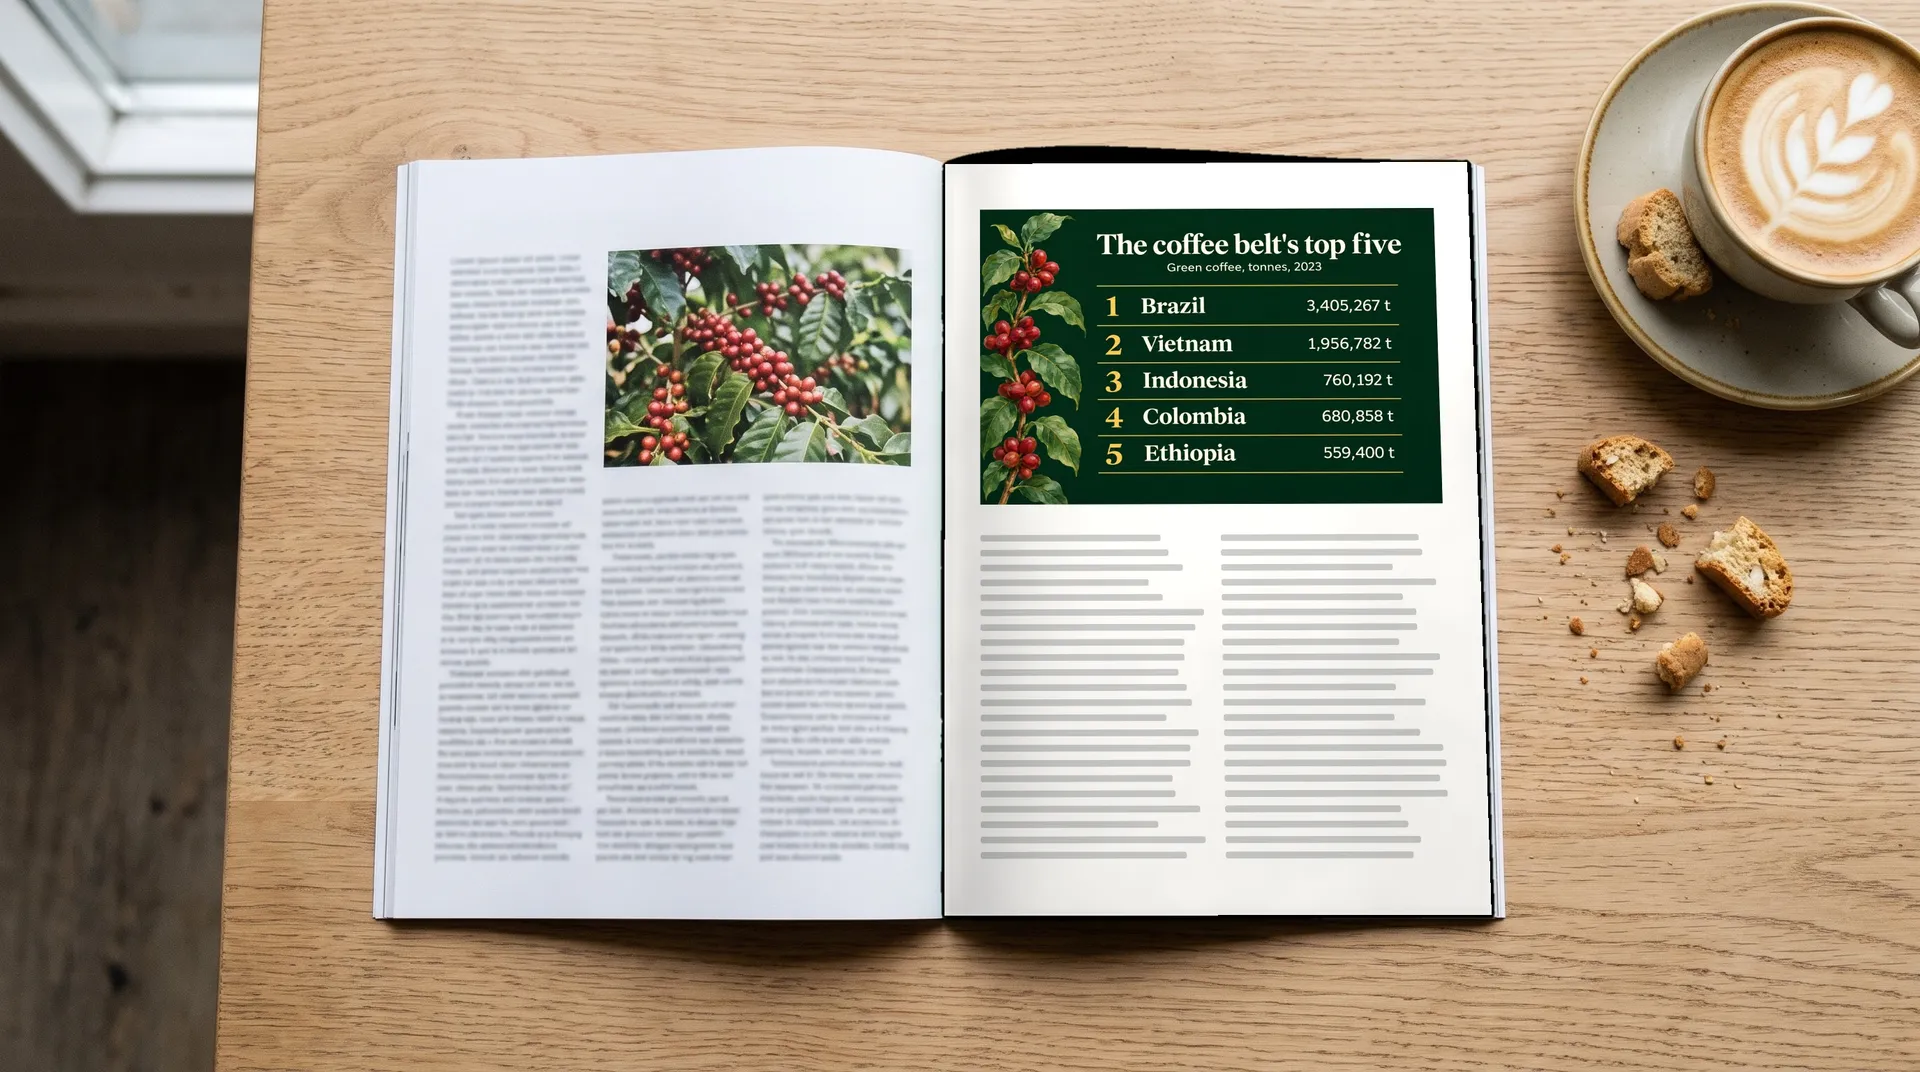
Landscape ranking infographic as a podium in a flat 1970s sports poster style: cream background, mustard, brick red and coffee brown, three podium blocks for 1st, 2nd and 3rd with a flat coffee sack on each: "1 Brazil 3,405,267 t" on the tallest block, "2 Vietnam 1,956,782 t" on the second, "3 Indonesia 760,192 t" on the third. Below the podium a short list: "4 Colombia 680,858 t", "5 Ethiopia 559,400 t". Title in a chunky slab serif: "World coffee champions, 2023". No other text, no flags, no gradients, no 3D, no decorative dashes, sparkles or motion lines.
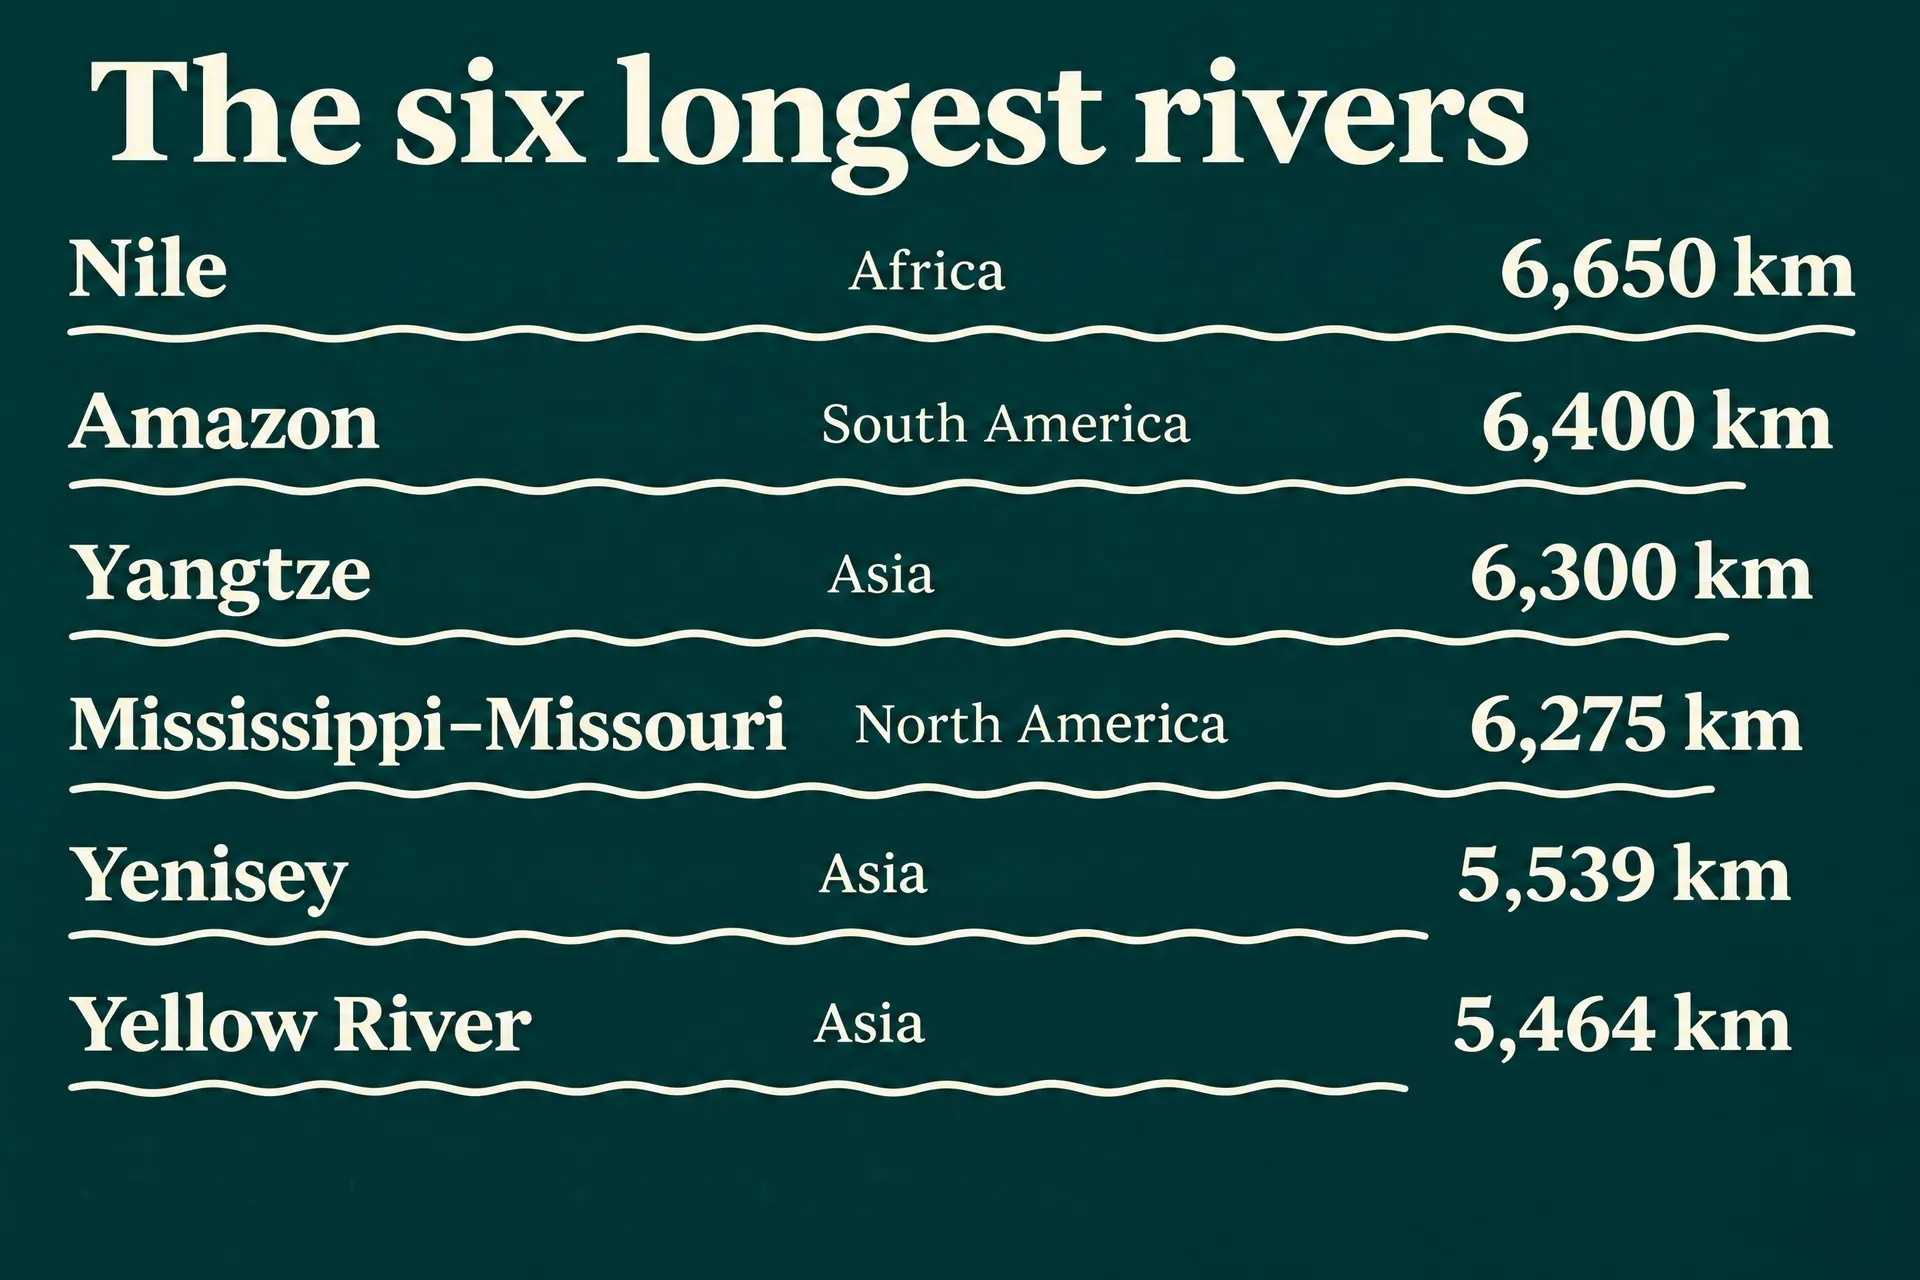
When sources disagree on a figure, take every number from one source and mention it in the caption. River lengths are a good example: different sources measure them differently.
Where to use an infographic
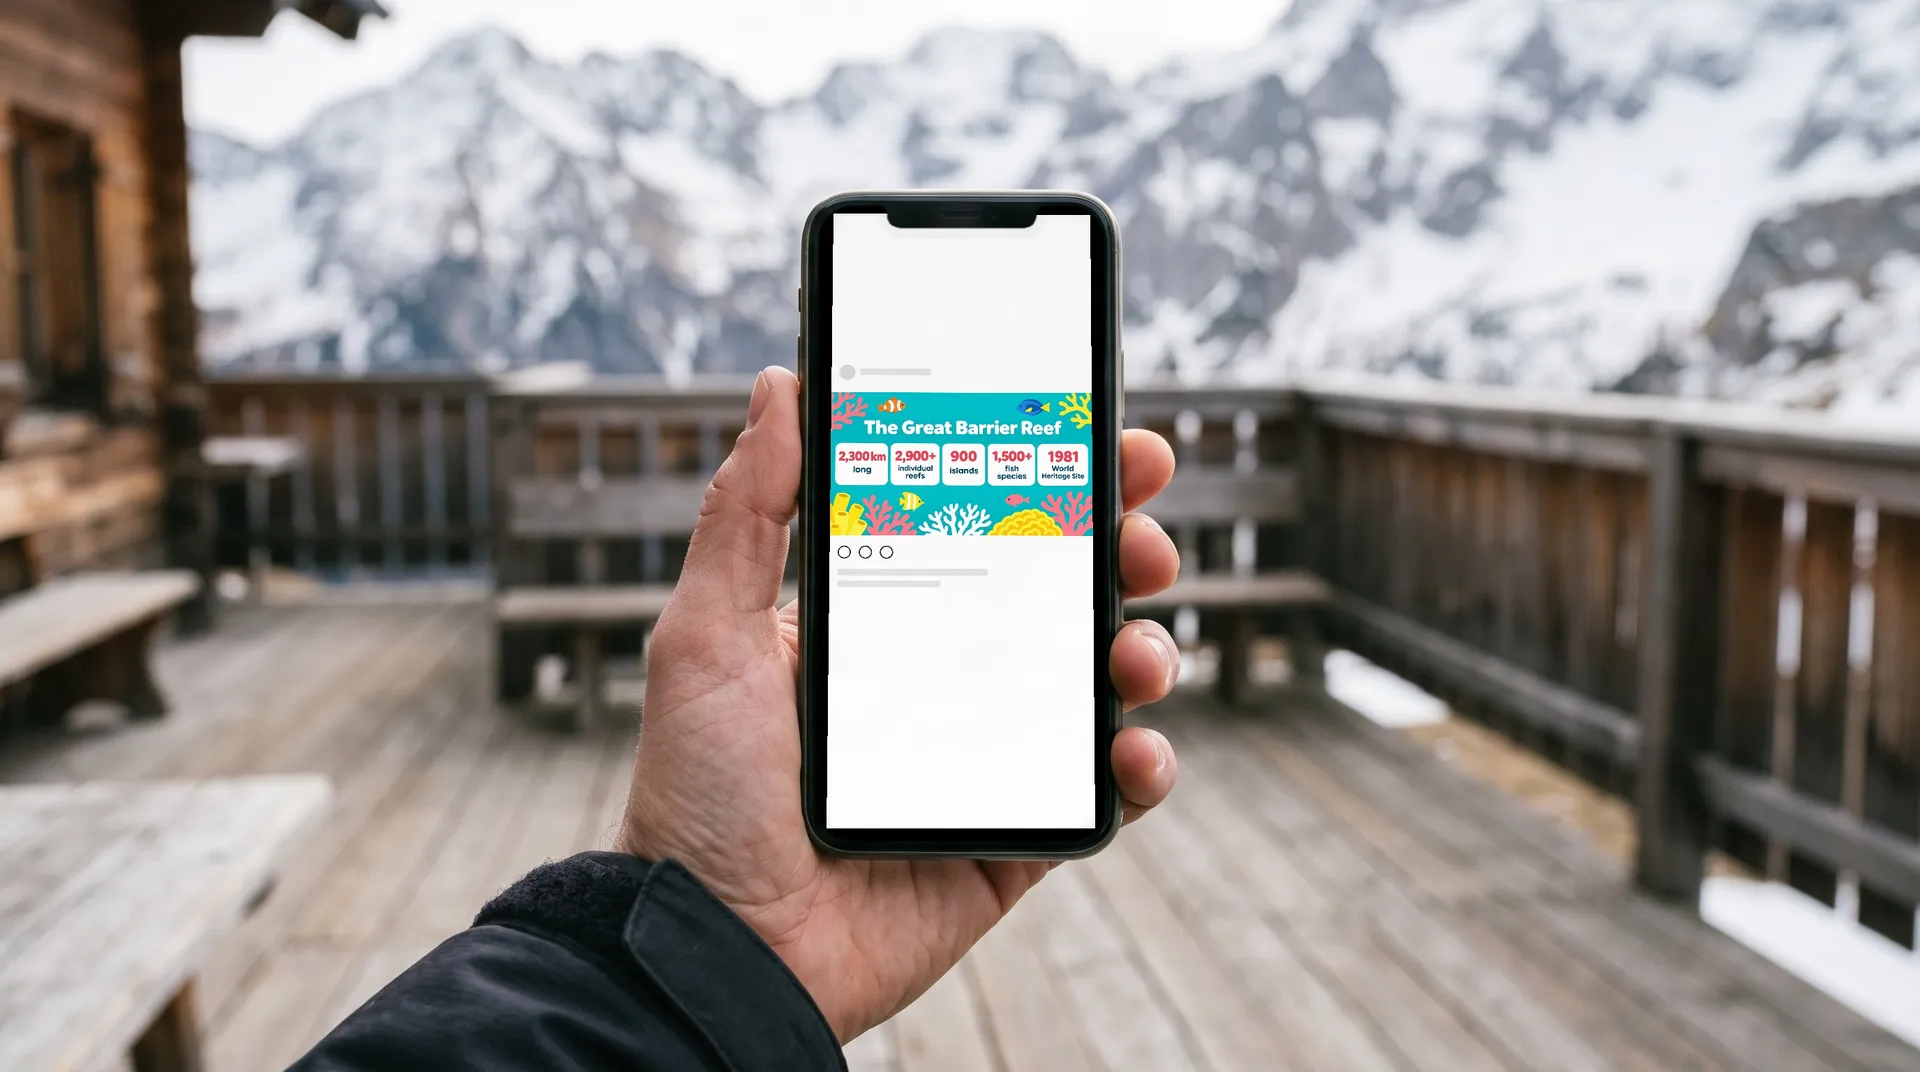
Generate the infographic at the shape of the place it will be seen: wide for slides, reports and wall panels, square or portrait for social posts, tall for posters. The same graphic can then go on a museum panel, a report page, a classroom board or a phone screen.
The AI infographic generator page has more prompts, including a map and a stat poster. For a whole set of brand graphics in one look, see how to create a brand visual identity with AI.
Bottom Line
A good infographic answers one question with real, checked numbers. Choose the type that fits the question, write every label and figure into the prompt in quotes, name a style and credit your source where you publish it. Generate a few versions, keep the clearest, then check every number against your source before you share it. To start with your own data, make your infographic on getimg.ai using one of the prompts above.
Frequently Asked Questions
The most common types are statistical, timeline, comparison, process and ranking infographics. Others include maps, which show data by place, and list infographics, which present tips or facts without much data. Pick the type that matches the question your numbers answer.
Collect your data from a reliable source, pick the infographic type, then design the layout with a short title and clear labels. With AI, you describe the layout and style in a prompt and write every label and number in quotes, then check the result against your data.
Yes. Image models handle layout, illustration and short text well. They don't know your data, so supply every figure in the prompt and check each one before you publish. Drawn shapes such as bars may not match the values exactly.
One clear question, a small number of checked figures, short labels, a layout that matches the data and a source you credit. If someone can't get the main point in a few seconds, cut data points or split it into two graphics.
Use the shape of the place it will appear: 16:9 for slides and wide panels, 1:1 or 4:5 for social feeds, 2:3 for posters. Generate at the right ratio rather than cropping later, so no labels get cut off.
Related Articles